.svg)
Analytics finds shared-HVAC faults, after-hours waste, and tenant load issues — savings depend on meter detail and quick follow-up.


If you want the short answer: energy analytics can cut waste in multi-tenant office buildings, but the best results come from acting on the data.
From the studies in this article, I’d boil it down like this:
In other words: the software helps, but data quality, meter detail, and follow-up decide the result.
Here’s the main takeaway for you: if you run or own a multi-tenant office building, focus on shared system faults, after-hours use, tenant/base-building splits, and clear alert ownership. That’s where the studies show the most consistent gains.
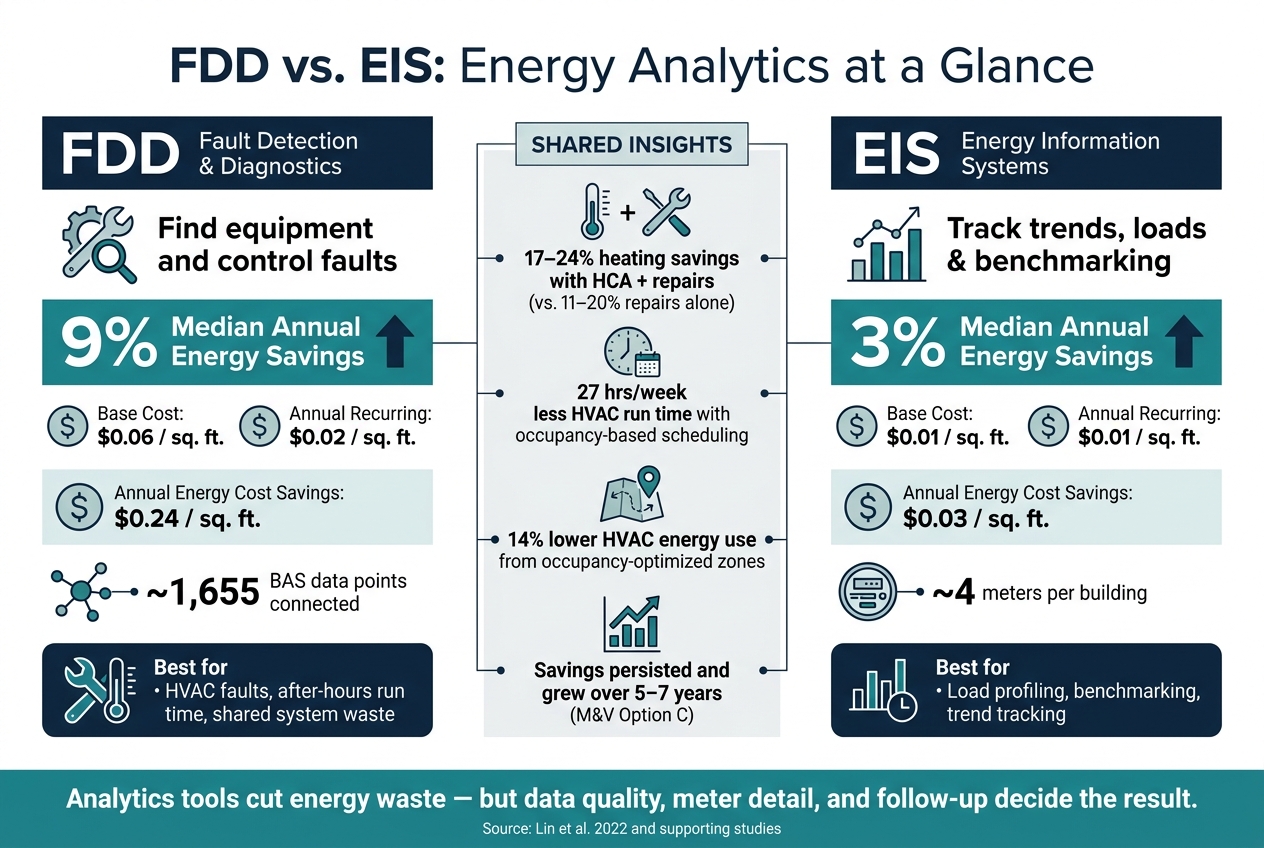
FDD vs EIS: Energy Analytics Savings & Costs for Multi-Tenant Office Buildings
| Tool | Main Job | Median Energy Savings | Typical Cost |
|---|---|---|---|
| FDD | Find equipment and control faults | 9% | $0.06/ft² base, $0.02/ft² annual |
| EIS | Track trends, loads, and benchmarking | 3% | $0.01/ft² base, $0.01/ft² annual |
I see the article’s core message as simple: in multi-tenant buildings, analytics works best when teams use interval data to spot waste fast and then fix schedules, controls, or tenant cost signals without delay.
Recent studies show that energy analytics can cut energy use in multi-tenant office buildings. And the bigger savings tend to come from FDD, not EIS. In these buildings, the main opportunities usually show up in shared HVAC, common areas, and the way tenant activity changes loads across the day.
A 2022 study by Lin et al. found that organizations using FDD tools cut annual energy use by a median 9%. By comparison, organizations using EIS tools cut annual energy use by a median 3%.
The price to put these tools in place is fairly low. FDD has a median base cost of $0.06 per sq. ft. and a median recurring annual cost of $0.02 per sq. ft. EIS costs even less, with median base and recurring costs of $0.01 per sq. ft. each.
| Tool Type | Median Annual Energy Savings | Median Base Cost (per sq. ft.) | Median Recurring Cost (per sq. ft.) |
|---|---|---|---|
| Fault Detection & Diagnostics (FDD) | 9% | $0.06 | $0.02 |
| Energy Information Systems (EIS) | 3% | $0.01 | $0.01 |
That said, the savings don't appear by magic. They depend on what teams measure, which signals they pay attention to, and how fast they act on what the data shows.
Granular interval data and submeter data can show equipment-level faults and waste that whole-building data often misses. That's a big deal in multi-tenant buildings, where one bad schedule, stuck damper, or drifting control loop can hide inside a building-wide average.
In the research, these analytics tools were especially useful for finding specific faults and waste in shared HVAC and control systems.
Analytics tends to save more when teams move through alerts fast and assign clear follow-up steps. In practice, that means occupancy data and operating data need to lead to action, not just dashboards.
If nobody owns the alert, it sits. If the right team gets it early, waste can be cut before it turns into a month of extra run time or after-hours conditioning. That's where the strongest use cases start to show up.
Those savings don’t happen by accident. They come from how teams measure performance in the first place. Recent studies put most of their attention on EIS and FDD: tracking interval data, comparing load patterns, and spotting faults in shared systems and tenant-controlled spaces. A smaller group of studies also looks at occupancy-based control.
The main measures that show up across the research are Energy Use Intensity (EUI), peak demand, after-hours load, and the tenant vs. base-building energy split through HCA.
Researchers usually report savings in two ways: as a share of annual energy use and as dollars per square foot. FDD delivers median annual energy cost savings of $0.24/ft², while EIS delivers $0.03/ft².
The research is strongest in a few areas. It most often points to fault detection in HVAC systems, load profiling from interval meter data, and tenant cost allocation through heat cost allocation (HCA).
That last use case stands out. HCA plus repairs produced 17–24% heating energy savings, compared with 11–20% for repairs alone. Put simply, when cost allocation is added to the mix, the results improve.
Post-retrofit verification is also well documented. Studies using Measurement & Verification (M&V) Option C found that savings from analytics-driven improvements lasted and even increased over 5–7 years.
That matters a lot in split-incentive buildings. Usage reports by themselves reduced less than cost allocation did. Tenants changed behavior more when the savings showed up in dollar terms.
| Use Case | Data Source | Analytics Method | Measured Outcome |
|---|---|---|---|
| Tenant Cost Allocation | Interval meters / Sensors | Heat Cost Allocation (HCA) Algorithm | 17–24% heating energy savings |
| Fault Detection | BAS trend data | Automated FDD software | 9% median annual energy savings |
| Load Profiling & Benchmarking | Hourly interval meters | EIS visualization & benchmarking | 3% median annual energy savings |
| Peak Demand | Gas and electric meters on shared systems | Peak load analysis | Lower peak demand in cold-weather months |
| Post-Retrofit Verification | Interval data | M&V Option C (avoided consumption) | Savings persisted and grew over 5–7 years |
These use cases point straight to the day-to-day changes teams can turn into standard practice.
Once the metrics are set, the research moves to a simpler question: what makes deployment stick? Across the studies, the same three needs show up again and again: reliable data, tight system integration, and clear ownership of follow-up. It starts with the data itself - both its quality and how much of the building it covers.
EIS platforms average about 4 meters per building, while FDD systems connect to about 1,655 BAS data points, which helps explain why they serve different jobs. The studies show that the best deployments bring together meter data, BAS trends, and occupancy sensors in a single analysis pipeline.
One pattern keeps surfacing in the research: HVAC schedule optimization based on measured occupancy patterns. In Zaanstad Town Hall in the Netherlands, part of the EU OPTIMUS pilot project from 2013 to 2016, researchers found that grouping employees with similar arrival and exit patterns into shared thermal zones cut HVAC operation by 27 hours per week and reduced HVAC energy use by 14% compared with a fixed, occupancy-independent schedule.
There’s also a practical point here. Use anonymous, zone-level occupancy profiles to protect privacy while adjusting stop/start schedules. That gives operators data they can act on without turning the building into a surveillance tool.
When those occupancy patterns flow straight to operators, action tends to happen sooner. MBCx turns analytics findings into repairs or schedule changes, and human review is what turns alerts into savings.
Interval meter data works best when paired with BAS trend data. That combination helps teams verify whether schedule changes or retrofits are actually lowering energy use, instead of just looking good on paper.
Even with these patterns, the research has limits. Jason Block et al. put it plainly: "Variation in building specifics makes it difficult to provide precise energy and financial savings estimates." That line gets to the core issue.
For U.S. office owners, the biggest gaps are pretty clear. Most studies still look at savings at the whole-building level. That makes it hard to separate the effect of lighting from plug loads or other end uses. On top of that, limited meter-level data makes portfolio-wide comparison harder when buildings run on different data systems. This becomes a bigger problem in mixed-tenant buildings, where usage patterns, lease terms, and metering setups can vary from one floor or suite to the next.
There is also a day-to-day operating issue. The studies point to a need for simpler data integration and more efficient processes for acting on analytics outputs. And while Heat Cost Allocation (HCA) is common in the European Union, it is still in the early stage for the U.S. market as a way to deal with tenant-driven energy waste.
Taken together, the studies lead to one practical rule: analytics tools can cut energy use, but the result depends on data quality and follow-through. Those benchmark results only mean much when teams respond to alerts and use the data in a disciplined way.
After mechanical repairs, tenant-facing feedback can help. But cost allocation appears to change behavior more than feedback alone. In multi-tenant buildings, where split incentives and shared systems make almost every choice harder, that difference matters. Owners and facility teams should pair analytics with a clear response process. Software alone does not save energy.
Use EIS for meter-level monitoring, whole-building energy tracking, and data visualization. It helps you spot broad efficiency opportunities and verify utility savings.
Use FDD when you need automated detection of poor performance or mechanical issues in specific systems, such as HVAC. It’s better for finding root causes and supporting proactive maintenance.
Energy analytics in multi-tenant office buildings depends on reliable, well-organized data. In most cases, that data is managed through EMIS.
The main inputs usually include utility bills, interval meter data, weather data, and day-to-day operating data from BAS, IoT devices, and distributed energy resources.
When teams need a closer look, submetering helps split tenant energy use from energy used in common areas. Analytics can also pull in indoor environmental data, HVAC status, and occupant counts.
Building owners can use submetering to track each tenant’s after-hours energy use and bill them for what they actually use. When submetering is automated, operators get real-time data that helps them spot unusually high usage and notify tenants right away.
Building managers can also use Energy Management and Information Systems to share feedback reports that compare a tenant’s energy habits with similar tenants. That kind of side-by-side view can nudge people to change how they use energy.


