.svg)
Spot hidden energy waste, detect equipment faults early, prioritize repairs by cost, and verify savings with anomaly detection.

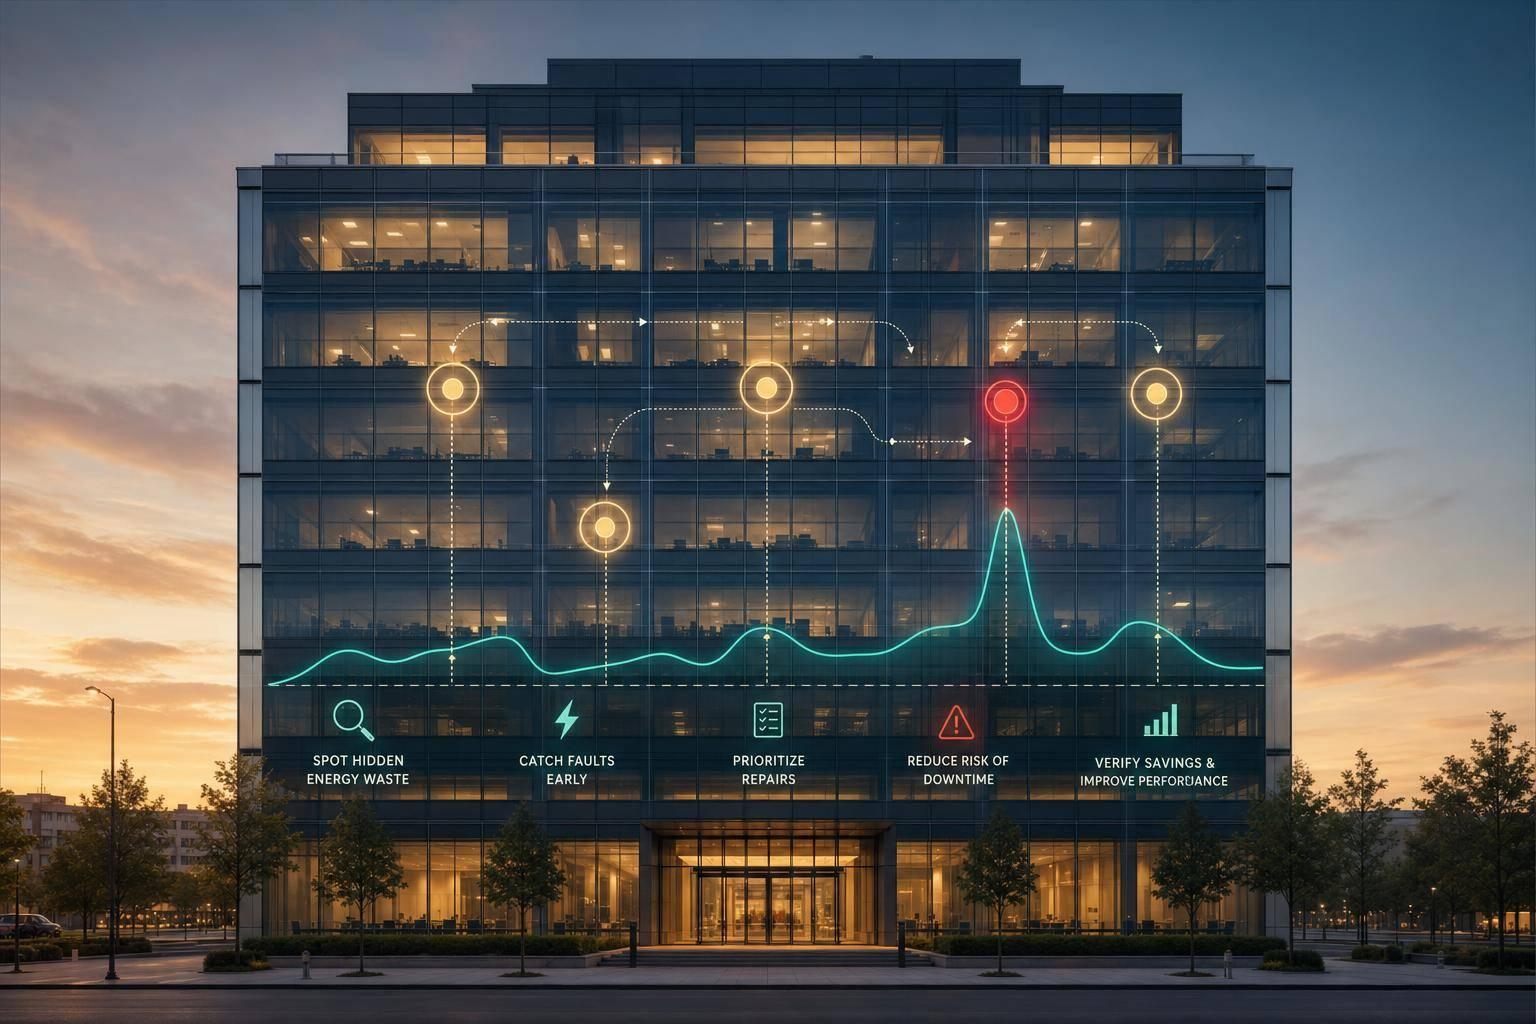
Buildings often waste 25% to 30% of the energy they use. I’d sum up energy anomaly detection like this: it helps you spot waste, find equipment issues early, plan repairs with data, cut utility costs, and track energy goals with more confidence.
If you want the short version, here it is:
A few numbers make the case fast. Teams using FDD tools report median annual energy savings of 9%. Peak demand charges can account for 30% to 50% of an electricity bill. And catching a fault early can cut repair cost from about $18,400 to $3,200.
Here’s the quick comparison:
| Benefit | What it helps with | Example impact |
|---|---|---|
| Lower utility costs | Finds waste sooner | 5% to 9% office energy cost cuts |
| Better efficiency | Flags drift and schedule mismatch | Less after-hours HVAC and lighting use |
| Earlier fault detection | Spots equipment trouble before failure | Lower repair costs and fewer emergency calls |
| Smarter maintenance | Prioritizes issues by cost | Focus on the highest-dollar problems first |
| Better energy management results | Tracks if fixes hold over time | 9% median annual energy savings with FDD |
If I were managing a building, I’d look at anomaly detection as a simple way to turn energy data into action instead of waiting for the next utility bill.

Energy Anomaly Detection: 5 Key Benefits & Cost Impact for Buildings
One of the fastest ways to cut utility costs is simple: spot waste early.
Continuous monitoring helps your team see odd energy use before it drags on for an entire billing cycle. That same view also makes it easier to find systems that are working harder than they should.
The savings usually show up in two places. First, there's day-to-day waste. A drifted sensor can cost a 100,000 sq. ft. office $5,000 to $15,000 per year. Second, there's demand charge exposure. Peak demand charges can make up 30% to 50% of a commercial electricity bill, and they're often set by a single 15-minute window. If you catch a sharp morning ramp or a sequencing error before it pushes up your peak, the building can avoid a costly spike that month. And in many cases, those same patterns hint at parts that are starting to fail before they break.
A fast alert can catch a refrigerant leak before it becomes a costly energy drain.
The numbers back this up. Organizations using Fault Detection and Diagnostics (FDD) tools report a median annual energy savings of 9%, with HVAC-specific reductions reaching 9% to 15%. For a typical office building, energy cost reductions often land in the 5% to 9% range. That means savings you can see directly on the utility bill.
Lower utility costs matter. But anomaly detection also shows how well a building is running day to day.
That matters because even modern equipment can waste energy when controls, sensors, or schedules stop lining up. Most building management systems are reactive. They’ll often flag a clear failure, like a sensor reading zero or a piece of equipment going down. But they can miss the gray area between “working” and “working well.” A pump running 8% harder than its baseline isn’t broken, yet it can quietly waste energy every hour it runs.
Once a learned baseline is set, it becomes much easier to spot slow drift and control mistakes before they pile up. Multivariate monitoring looks at the relationship between dozens of signals at the same time. That helps catch problems like poor valve or damper sequencing, where system output drops but no obvious alarm goes off. Continuous monitoring also helps teams find slow drift - gradual degradation that builds over weeks or months and may never stand out in a monthly bill comparison.
The same idea applies to lighting and plug loads. Anomaly detection can flag gaps between equipment schedules and actual occupancy. A common example is after-hours runtime, like lights or HVAC running all weekend because someone left a manual override in place. When smart lighting controls are paired with energy monitoring, facility teams can make targeted schedule fixes based on occupancy data. Those patterns also give teams a clearer place to start when adjusting controls.
Anomaly detection doesn't just cut waste. It also helps teams catch equipment problems before a unit goes down.
Most equipment doesn't fail all at once. It drifts. Performance slips bit by bit, then one day the failure becomes impossible to ignore. AI anomaly detection can flag that drift weeks before a breakdown, while a standard BMS usually sends an alarm only after a set threshold is crossed. By that point, damage may already be underway.
That timing gap matters a lot for cost. When a fault is caught early through AI-driven monitoring, repair costs can drop to about $3,200 per incident, compared with $18,400 for a reactive fix after failure.
AI can pick up fault patterns across signals like:
Those patterns can point to problems such as fouled coils or compressor wear before the equipment fails.
Some faults are easy to miss. A hidden sensor issue can sit there in plain sight: the BMS compensates, occupant comfort looks stable, and energy waste keeps growing.
The gap in detection rates is hard to ignore. About 73% of equipment failures are detectable ahead of time through anomaly signals, compared with only 27% caught by threshold-based systems. Machine-learning anomaly detection brings most of these faults to the surface before failure, and teams can confirm the fix by watching the same trend line after the repair. That lead time turns emergency calls into planned maintenance.
Early detection only helps when teams do something with it. Once a system flags an anomaly, the next job is deciding what matters most, what can wait, and who should handle each issue.
When an anomaly is flagged, the system can attach a severity rating and an estimated cost impact. That gives facility teams a simple way to sort issues by dollar impact. For example, a simultaneous heating and cooling conflict in a 100,000 sq. ft. office can quietly waste $15,000 to $40,000 per year. Put that number next to a minor after-hours runtime deviation, and the priority becomes much easier to see.
The next step is routing each alert to the team that can act on it. Confirmed alerts should go straight to the right people. Energy managers can get consumption pattern summaries, while technicians receive equipment performance flags along with asset history, recommended actions, and needed parts. That way, a technician isn't left piecing the problem together from scratch. A confirmed alert should clearly show the asset, the likely cause, and the recommended action so the response can happen fast.
After the repair, the system can keep tracking the same pattern to make sure the issue doesn't come back. That ties maintenance to clear data instead of guesswork.
Once teams fix waste and faults, anomaly detection helps show whether those fixes stick. It turns day-to-day operating waste into something teams can track and act on.
Anomaly detection learns how each building normally runs, then flags drift that simple thresholds often miss. That means sustainability results can be measured instead of guessed.
Organizations using Fault Detection and Diagnostic (FDD) tools achieved a median annual energy savings of 9%. For teams aiming to hit sustainability goals or support ESG reporting, anomaly detection creates a clear data trail for precise Measurement and Verification (M&V). Instead of estimating carbon cuts, the system measures actual savings against a verified baseline - supporting verified carbon and energy reporting.
Continuous monitoring also helps close the performance gap - the difference between how a building was designed to run and how it performs day to day. And as occupancy shifts, models can recalibrate so energy targets match actual use. That gives teams proof they can use to decide what to tackle next.
Energy anomaly detection keeps waste in plain sight every day, not just when you run an audit. In U.S. commercial buildings, an estimated 25% to 30% of energy use is wasted, and most of that waste comes from day-to-day operations. That matters because this kind of waste usually won’t show up in a one-time audit. And even if you fix it once, it can creep back without steady oversight. That’s the difference between spotting waste in the moment and just reporting on it after the fact.
It can catch systems that are running poorly before the losses snowball - things like simultaneous heating and cooling, after-hours runtime, and sensor drift. This applies across a range of building types, including office campuses, warehouses, industrial facilities, and municipal buildings. When how a building is used changes, recalibration becomes a must.
Recalibrate models when building use changes for good. If schedules or occupancy shift and the model isn’t updated, the system may flag normal behavior as a problem or miss waste that’s actually happening.
Cost impact should guide what gets fixed first. In a 100,000 sq. ft. office, the table below shows which anomaly types can hit the budget the hardest:
| Anomaly Class | Est. Annual Cost |
|---|---|
| Simultaneous Heat/Cool | $15,000 – $40,000 |
| Demand Spike Patterns | $10,000 – $50,000 |
| Occupancy Mismatch | $12,000 – $35,000 |
| After-Hours Runtime | $8,000 – $25,000 |
| Sensor Drift | $5,000 – $15,000 per sensor |
(Source: Build Smart Guide, 2026)
Once you’ve ranked the anomalies, the last step is to close the loop. Every flagged issue should lead to a work order, a repair, and a verification check - not just another dashboard alert. For lighting-related waste, pair anomaly detection with a lighting audit to spot upgrade opportunities.
Energy anomaly detection keeps a constant watch on building data to tell the difference between normal operation and wasteful or abnormal behavior.
It usually does three things:
Energy anomaly detection systems can track a wide range of building systems by pulling data from smart meters, building management systems, and IoT sensors.
That usually means HVAC, electrical systems, lighting, and utility use like water, gas, and electricity. They can also use temperature, humidity, and occupancy data to tell the difference between normal building behavior and a true anomaly.
Routine sensor calibration keeps measurements accurate as conditions shift over time.
Baseline data collection usually needs 4 to 12 weeks before it becomes dependable. During that stretch, the system should be watched closely. Regular checks and standardized data formats help keep analytics precise and useful.


