.svg)
Track lighting costs, controls, and quality by inventorying fixtures, installing meters, using 3–5 KPIs, and linking alerts to maintenance.

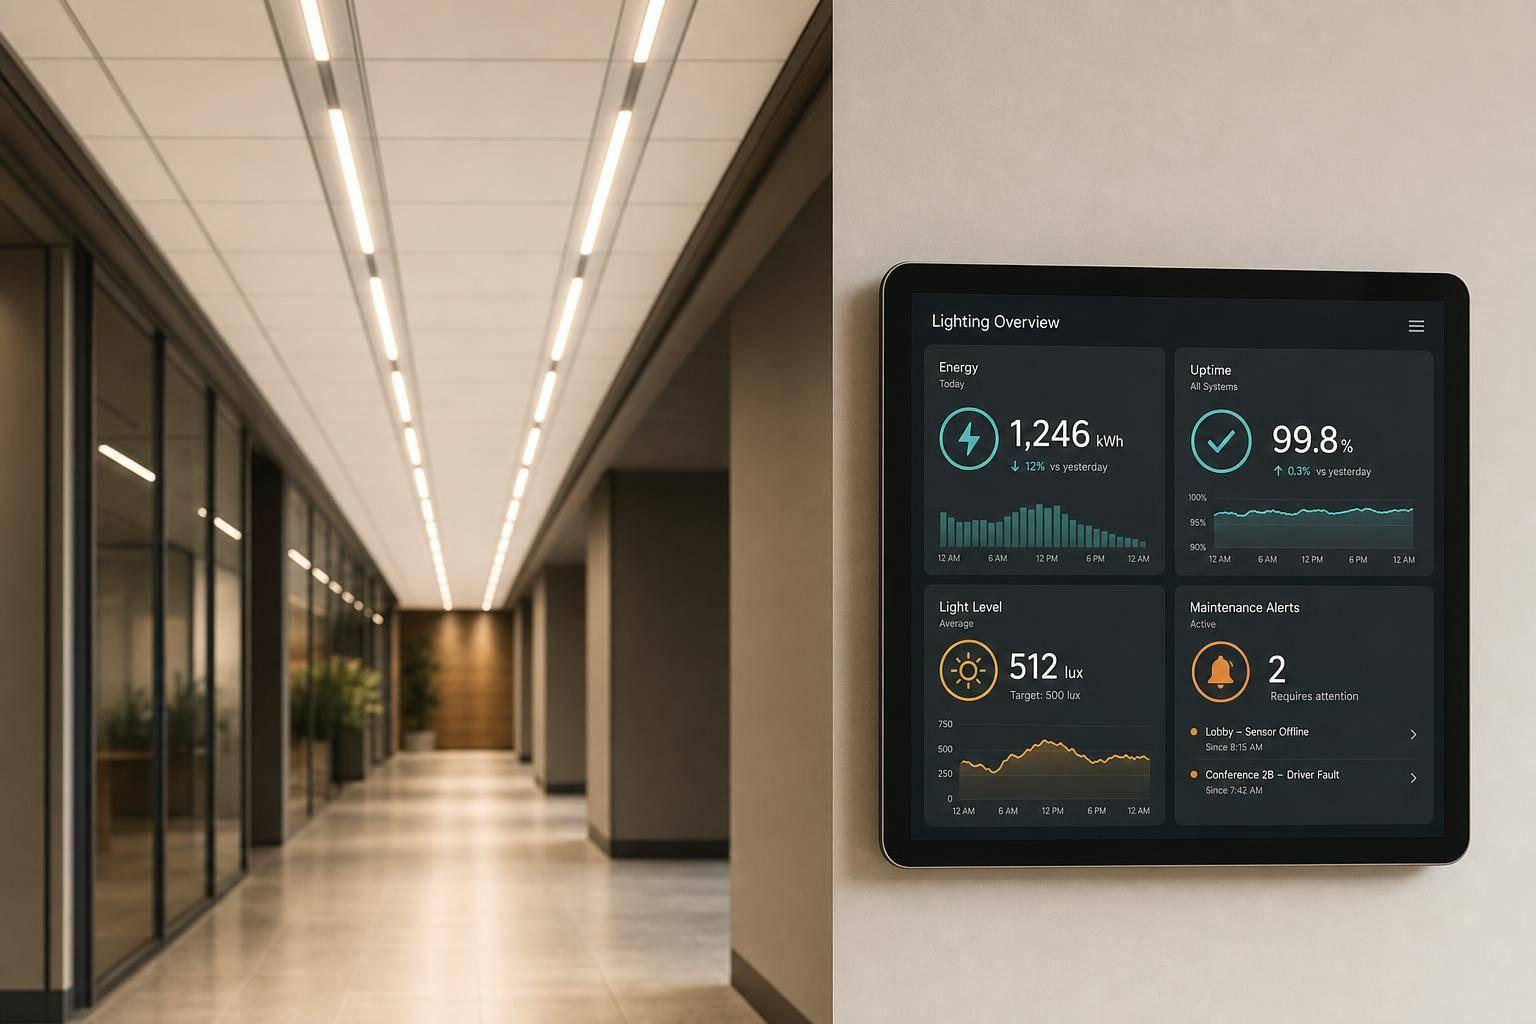
Lighting can account for 20% to 40% of a commercial building’s electricity use, so I’d monitor it in three ways: power use, system behavior, and light output. That means I’d first map fixtures, zones, controls, and schedules; then add the right meters and sensors; then track a short KPI list like kWh, peak demand, after-hours runtime, sensor response, and light-level issues. If I connect alerts to maintenance, I can catch schedule errors, sensor drift, and fixture faults before they sit for weeks or turn into a safety problem.
Here’s the short version:
A few numbers stand out:
If I were setting this up, I’d keep the goal simple: see where lighting costs money, where controls fail, and where light quality drops.

How to Monitor Commercial Lighting Systems: 3-Step Framework
| Area to monitor | What I’d watch | Why it matters |
|---|---|---|
| Electrical | kWh, kW, voltage, current, power factor | Shows cost, demand exposure, and meter-based reporting |
| System behavior | Runtime, dimming levels, occupancy response, after-hours use | Finds waste, bad schedules, and control problems |
| Visual | Light levels, dimming response, uniformity, dark spots | Shows whether spaces still have the light they need |
| Monitoring level | Best for | Main limit |
|---|---|---|
| Panel-level | Whole lighting panels | Less detail by zone |
| Circuit-level | Specific circuits or mixed-use panels | More hardware and setup |
| Fixture-level | Per-light data and fault checks | Needs compatible drivers and more setup |
That’s the core of it: know what you have, meter the right points, watch a few useful KPIs, and tie alerts to maintenance action.
After you set your goals, start by documenting the lighting system you already have before you add meters or dashboards. That inventory is the backbone of the whole setup. It’s what makes later KPIs and alerts worth anything, because it lets you tie each meter reading to a zone, control type, and schedule. Put simply: you need to know what’s installed and how it’s supposed to work.
Survey each area and log every fixture’s type, wattage, quantity, mounting height, and condition. If something looks dusty or damaged, flag it. That matters because dust and damage can reduce light output without changing energy use.
Next, group fixtures into zones based on space type. Keep offices, warehouses, parking areas, corridors, egress paths, retail areas, and any 24/7 spaces separate in your records. If you lump them together now, the monitoring data gets muddy later. For each zone, record the controls in place, such as manual switches, occupancy sensors, daylight sensors, dimmers, time clocks, or networked controls.
| Inventory Category | Key Data Points to Record |
|---|---|
| Fixtures | Type, wattage, lamp/ballast type, quantity, condition, mounting height |
| Zones | Space type (office, warehouse, egress), square footage, priority level |
| Controls | Sensor types, dimming capability, timers, protocols |
| Schedules | Daily/weekly operating hours, 24/7 requirements, peak usage periods |
| Baseline | Historical kWh (12–24 months), maintenance logs, utility rate data |
Once the asset list is done, you can place meters where they separate lighting load from the rest of the building systems.
Electrical data only helps if the meter is in the right place. The goal is to pick the lowest-cost meter level that still isolates the load you want to track.
Panel-level meters with current transformers (CTs) inside panelboards are usually the best place to start. They’re the lowest-cost option in many cases, and one panel meter can cover an entire lighting panel. That works well when lighting has dedicated panels. The downside is simple: panel data alone won’t tell you which zone failed.
Circuit-level sub-meters give you a closer look by isolating specific lighting circuits. They make sense in mixed-use panels where lighting shares space with other loads. If early fault detection is a big deal, this level of monitoring is often the better fit.
For the closest view, fixture-level monitoring through smart drivers, DALI-2 bus feedback, or Power over Ethernet (PoE) gives you per-luminaire watt readings and runtime. But there’s a catch. You need compatible drivers, and the wiring setup is more involved.
Use revenue-grade meters that meet ANSI C12.20 class 0.2 if you plan to apply for rebates or incentives. Standard sub-metering grade is usually around ±2%, which works for internal benchmarking but usually won’t meet utility program rules.
Once the meters are installed, they also need a way to send data to your monitoring platform. Wired options like RS-485 (Modbus RTU) are dependable. Wireless options like Zigbee or LoRaWAN are often easier in retrofit jobs where running new cable would be a headache.
After installation, make sure each device reports the right space, schedule, and response.
Before you rely on any of the data, test the system. A quick setup check isn’t enough here. You want to know the readings line up with what’s happening in the space.
Run through three checks:
Also verify device names and map each circuit to a zone on the floor plan. Update panel schedules and as-built drawings so they show any new CTs or monitoring hardware. Some rebate programs ask for calibration certificates before they’ll accept the data, so check that before commissioning is finished.
Once your meter data is clean, the next move is simple: turn those raw readings into dashboards, KPIs, and alerts that people can actually use.
The goal isn't to build a giant dashboard packed with charts no one checks. It's to show each team the signals that matter to them. Maintenance teams need exception alerts. Energy managers need trend lines. Directors usually need cost snapshots they can take straight to leadership.
Start with energy intensity and peak demand because both have a direct effect on utility costs. Demand charges can make up 30% to 50% of a commercial electricity bill, so even small gains here can make a clear dent in spend.
Then add a short set of operating and maintenance KPIs. After-hours runtime helps you spot zones that stay on when the building is empty. Occupancy activation rate shows whether sensors are changing behavior or just sitting there doing nothing. Fault counts and wattage anomalies can point to driver wear or fixture failure early, before the issue turns into a safety problem.
For routine monitoring, collect data every 15 to 60 minutes. If you need LEED v4.1 compliance or want a closer view of load shifts, use 15-minute interval metering.
Use the same KPI set across sites. That makes trends and exceptions much easier to compare.
| KPI | Data Source | Why It Matters |
|---|---|---|
| Monthly kWh | Revenue-grade meters or sub-meters | Tracks total consumption against energy budgets and sustainability goals |
| Peak Demand (kW) | Panel-level smart meters | Identifies lighting's contribution to peak utility charges |
| Energy Intensity (kWh/sq ft) | Total kWh ÷ facility square footage | Enables benchmarking across properties and floors |
| After-Hours Runtime | Load trends / heatmaps | Detects zones that stay on when the building is empty |
| Occupancy Activation Rate | Occupancy sensors | Shows whether sensors are actually changing behavior |
| Daylight Harvesting Response | Photosensors / dimming drivers | Confirms that fixtures are dimming correctly in response to natural light |
| Wattage Anomalies | Fixture-level sensors or CTs | Detects driver degradation or fixture failure before it becomes a safety risk |
| Fault Counts / Outages | Smart drivers / load anomalies | Prioritizes maintenance before failures affect operations |
| Variance Against Baseline | Current vs. previous-year data | Shows whether changes are real after adjusting for seasonal noise |
Hourly and daily load trend charts make it easy to see whether lighting follows the expected occupancy curve or jumps at odd times. Heatmaps are especially useful here. A quick look can show which zones are wasting energy after hours .
For LED retrofit projects, compare live performance data against a modeled baseline that has been adjusted for occupancy and daylight. That gives you a cleaner read on whether the retrofit and its controls are doing what they were supposed to do. Normalize results by square footage and operating hours so site-to-site comparisons stay apples to apples.
These views set the team up for routine reviews and fault response in the next step.
Once your dashboards and alerts are live, give them a set review rhythm. Otherwise, data just sits there. Stick with the same zone names and KPIs you used during setup so each alert points to one clear area.
Daily or weekly, focus on load anomalies, after-hours runtime, and equipment running outside normal schedules. These are your early warning signs. They usually show you that something needs attention before it turns into a bigger issue.
Monthly, look at performance metrics alongside utility bills. Check energy intensity in kWh per sq ft across locations, compare cost to budget, and track year-over-year consumption and progress toward efficiency targets.
Quarterly, step away from the software and walk the building. Check sensor alignment, flicker, discoloration, and dark spots. A physical walkthrough will catch issues that dashboard data can miss.
Use these reviews to sort out schedule errors, sensor drift, and driver faults. Rule-based monitoring can flag common problems on its own, but the signal still needs interpretation.
Here’s what to watch for:
Without analytics, the average lighting fault goes undetected for 47 days. Set alert thresholds at 20–30% above baseline so you get early notice without a flood of false alarms.
Startup spikes can also muddy the picture. One simple fix is to stagger zone activation times by 5-minute intervals - for example, Zone 1 at 6:55 AM and Zone 2 at 7:00 AM.
When the same fault keeps showing up, send it straight to maintenance. Route notifications into your CMMS so each action is logged and fixture history stays up to date. Over time, that record helps you decide what to repair based on actual performance instead of a fixed schedule.
That change - from calendar-based work to condition-based maintenance - can cut both downtime and cost.
| Maintenance Type | Data Required | Timing | Effect on Downtime & Cost |
|---|---|---|---|
| Routine (Fixed) | Calendar/intervals | Fixed (e.g., every 6 months) | Higher labor cost; risk of premature replacement |
| Monitoring-Based | Real-time alerts, KPIs | Triggered by alerts | Minimizes downtime; reduces energy waste by 20–40% |
| Reactive | None (complaint-driven) | After failure | High downtime; emergency service rates of $800–$1,200 per call |
A smart place to start is with corridors, parking garages, and common areas. That’s where faults tend to hit safety and energy use the hardest.
Pick the simplest setup that still gives your team data you can use. That choice usually comes down to three things: the building, the budget, and how much detail you need before anyone can take action.
| Feature | Standalone Controls | BMS-Integrated Systems | Cloud-Connected / IoT |
|---|---|---|---|
| Monitoring Granularity | Low - panel or circuit level | Medium - zone or branch level | High - per-fixture data |
| Integration Complexity | Low; operates independently | High; requires BACnet/Modbus protocol matching | Moderate; needs gateway and internet connectivity |
| Data Available | Basic runtime and occupancy status | Load profiles, peak demand, system-wide trends | Real-time wattage, driver health, granular heat maps |
| Best-Fit Building Types | Small retail, individual municipal offices, or simple retrofits | Large schools, multi-story offices, and complex municipal campuses | Warehouses, industrial facilities, and distributed portfolios |
If you only need a broad view, standalone controls may do the job. If you're managing a larger site and want lighting data tied into building operations, a BMS-linked setup can make more sense. And if you want fixture-level insight, cloud-connected lighting gives you that close-up view without guessing.
The goal is simple: match the setup to the level of detail you need, and skip extra layers that your team won't use.

Good monitoring starts long before the dashboard. It starts with fixtures, controls, and metering that can produce data your team can trust and use. Luminate Lighting Group designs LED retrofits with monitoring-compatible fixtures, controls, and sensors.
Luminate also provides photometric layouts and energy-audit documentation to support ASHRAE 90.1 compliance, utility rebate applications, and 179D tax deductions. For new or renovated buildings over 25,000 sq ft, ASHRAE Standard 90.1-2022 requires dedicated lighting sub-meters.
Good lighting monitoring usually follows the same path every time: build a full inventory, install and commission the right meters and sensors, track a small set of KPIs that matter, and tie alerts to maintenance workflows so issues get fixed instead of sitting in a report.
The best setup isn't the one with the most features. It's the one your team will check often and use in day-to-day work.
Start with a baseline assessment of your current lighting system. Write down the fixture types, wattage, operating hours, control methods, and whether you already have occupancy sensors or daylighting controls in place. Then measure illuminance levels in a few representative areas, such as desks and hallways.
After that, keep it simple. Review your existing utility bill or interval data first. If you need a closer look at usage, move to circuit-level sub-metering.
Choose based on your budget, technical setup, and how much detail you need.
Monitoring helps you spot trouble early, before it leads to failures or wasted energy.
It can flag issues like:


