.svg)
Compare fixtures by efficacy, CRI, CCT, delivered light (fc), and L70 to balance energy, quality, and lifecycle costs.

If I’m comparing lighting fixtures, I don’t start with price or wattage alone. I look at five numbers first: efficacy, CRI, CCT, delivered light/foot-candles, and L70.
Those five checks tell me if a fixture will:
That matters because the fixture price is often only 10%–15% of the 10-year cost. The rest comes from energy, labor, and upkeep. A fixture that looks cheap up front can cost more later if it wastes watts, misses light levels, or fades too soon.
Here’s the short version:
If I need a fast screen, I use these first-pass targets:
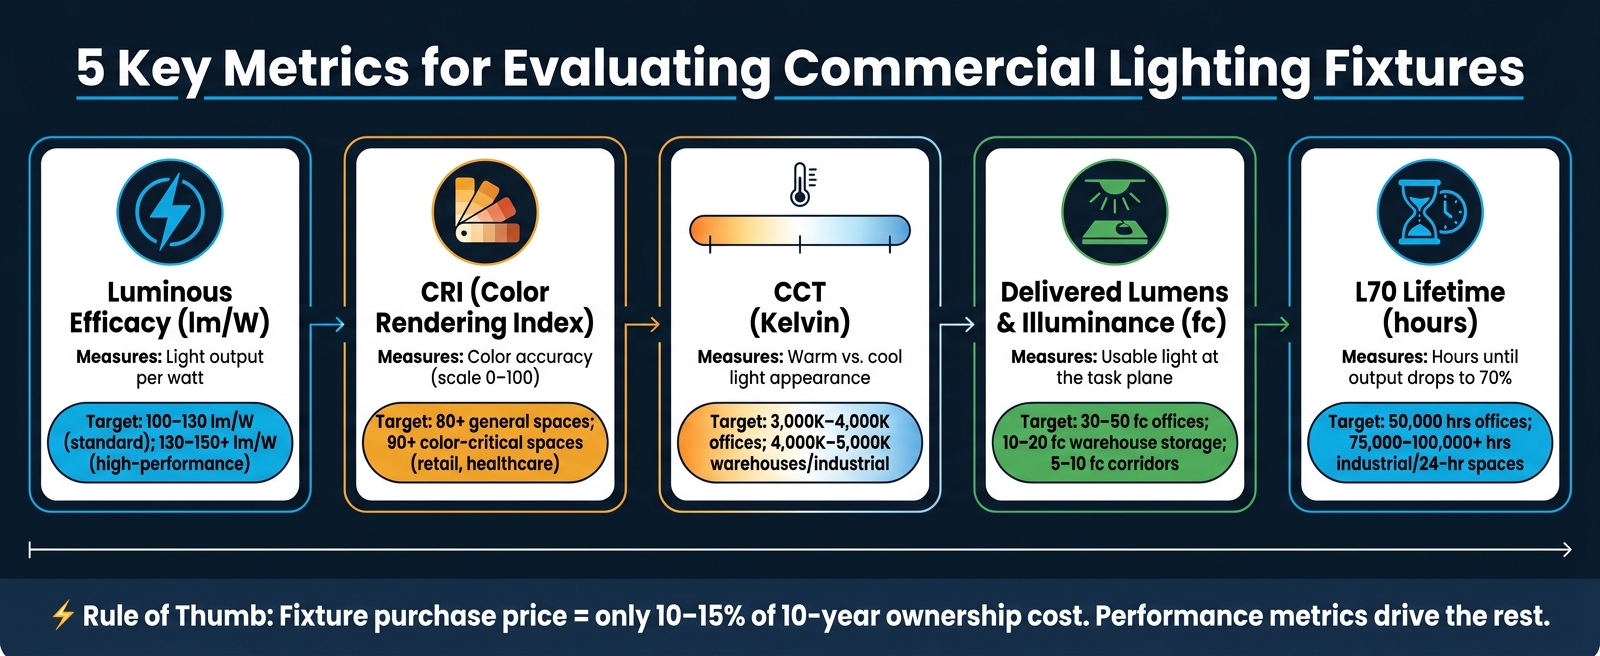
5 Key Metrics for Evaluating Commercial Lighting Fixtures
| Metric | What I check | Common target |
|---|---|---|
| Efficacy | Light output per watt | 100–130 lm/W |
| CRI | Color accuracy | 80+ general, 90+ color-focused spaces |
| CCT | Warm vs. cool appearance | 3,000K–5,000K |
| Illuminance | Light on the task plane | 5–50 fc+, based on space |
| L70 | Output over time | 50,000–100,000 hrs |
Bottom line: I use these five metrics together, not one at a time, to judge energy use, light quality, code fit, and upkeep cost.
These metrics matter because the sticker price almost never shows the full picture. In commercial lighting, the purchase price is often just 10–15% of the 10-year ownership cost once you add energy, installation, and maintenance. Most of the cost comes later, and it depends on how the fixture performs year after year.
LPD connects fixture performance to code compliance. High-efficacy fixtures can deliver the light level a project needs while using fewer watts, which helps keep the design within ASHRAE 90.1 limits. If fixtures perform poorly, teams may need more units or higher wattage to hit the same target. That drives LPD up and can create code problems during design.
Efficiency is part of the story, but optics decide how that output shows up in the room. Two fixtures can have similar lumen ratings and still look very different in use. One may spread light evenly across the space, while the other creates hot spots and dark areas. A well-designed fixture improves uniformity and can cut the number of fixtures needed to meet illuminance targets. That has a direct effect on installation cost and long-term energy use.
CRI and CCT shape comfort and visual accuracy. L70 becomes a big deal in high-bay or hard-to-reach areas, where relamping labor can cost more than the fixture itself.
That’s why audits and photometric layouts should be part of our proven process, not an afterthought. At Luminate Lighting Group, energy audits and photometric layouts help show where a space is overlit, underlit, or wasting energy, while also supporting rebate and 179D planning.
Of the five metrics, luminous efficacy is the fastest way to compare energy use.
It tells you how much visible light a fixture puts out for each watt it uses. The metric is shown in lm/W and is calculated by dividing lumens by watts.
Here’s the part that trips people up: check luminaire efficacy on the spec sheet, not source efficacy. Why? Because luminaire ratings account for driver, optic, and thermal losses. And those losses can eat up a big chunk of the efficiency gain.
A higher efficacy rating can help you meet code limits with fewer watts. It can also improve rebate eligibility.
Before you trust the number, verify it with LM-79 data from an accredited lab and a DLC Premium listing. Once efficiency is clear, the next question is whether the light renders color accurately.
After efficiency, the next thing to check is how well the light shows color.
Color Rendering Index (CRI) tells you how closely a light source displays colors when compared with a reference source at the same CCT. The scale runs from 0 to 100, and 100 is the closest match.
Here’s the key point: CRI measures color accuracy, not brightness. Two fixtures can put out the same lumens and still make a space look very different.
For most commercial spaces, CRI 80+ is the usual baseline. If color matters more, CRI 90+ is the better pick. That includes places like retail floors, healthcare exam rooms, and conference rooms. A simple example says it all: high-CRI lighting can make fruits and vegetables look fresh and appealing, while low-CRI lighting can make those same products look dull and washed out.
Low CRI can also create problems that show up later. People may complain that a space looks off. You may need extra accent lighting to fix the look. In some cases, fixtures get replaced sooner than planned. Those added costs can wipe out any savings from a lower fixture price.
There’s one catch. CRI, also called Ra, is based on eight pastel color samples. Because of that, it can miss errors in saturated colors, especially reds. So a fixture can have a CRI 90 label and still do a poor job with red tones. If you’re making color-critical choices, check R9 and TM-30 too.
| Application | Recommended CRI | Primary Reason |
|---|---|---|
| Retail & Showrooms | 90–100 | Product appeal and color accuracy |
| Offices & Schools | 80–90 | Visual comfort and concentration |
| Healthcare & Hospitals | 90+ | Skin tone accuracy and clinical observation |
| Warehouses & Industrial | 70–80 | Basic color differentiation and safety |
| Municipal Offices/Public Buildings | 80–90 | Clear visibility and wayfinding |
Next, CCT shows whether the light reads warm, neutral, or cool.
Once color accuracy is covered, the next thing to think about is appearance.
Correlated Color Temperature (CCT) describes how a light source looks, from warm to cool. It’s measured in Kelvin (K). A higher Kelvin rating means the light looks cooler, not that it gives off more heat.
Commercial lighting usually falls between 2,700K warm white and 6,500K daylight. In most commercial settings, the common range is 3,000K to 5,000K, depending on how the space is used.
CCT has a direct effect on how people experience a room. In one field study of office workers, 5,000K lighting was rated as brighter than 3,500K, but people also reported lower satisfaction and visual comfort under the higher CCT. Cooler light can help with visibility. But over a long workday, too much of it can feel harsh. That trade-off matters in spaces where people need to see well and stay comfortable.
The right CCT depends on the job the space needs to do:
| CCT Range | Appearance | Best For |
|---|---|---|
| 2700K–3000K | Warm white | Reception areas, lounges, break rooms |
| 3500K–4000K | Neutral white | Offices, classrooms, conference rooms |
| 4000K–5000K | Cool white | Warehouses, industrial floors, labs |
CCT shapes the mood of a space. CRI, on the other hand, controls how accurately things appear. For example, a 5,000K warehouse fixture still needs enough CRI to help workers tell apart labels, packaging colors, and safety markings.
Field-selectable CCT can be a smart fit for multipurpose rooms, council chambers, and conference spaces. These fixtures let installers choose from set options like 3,000K, 3,500K, or 4,000K at the time of installation.
After color and appearance, the next step is simple: check how much usable light actually reaches the work surface.
Delivered lumens are the amount of light that comes out of the fixture after losses from the optics, housing, and heat. Those losses can add up fast. In many cases, delivered lumens are 20–50% lower than the light made at the source.
Illuminance is the amount of light that lands on a surface. In the U.S., it’s measured in foot-candles (fc), and 1 fc = 1 lumen per square foot. That number only means something if you measure it at the right height. In offices, the task plane is usually about 30 inches above the finished floor. In warehouses, it’s often the floor. In manufacturing areas, it’s usually bench height. Get that wrong, and even a good fixture layout can miss the mark.
Here are some common target ranges to use as a starting point:
| Space Type | Recommended Illuminance | Task Plane |
|---|---|---|
| Open office / private office | 30–50 fc | 30 in. above floor |
| Conference room | 20–50 fc | Table height |
| Warehouse – bulk storage | 10–20 fc | Floor level |
| Warehouse – picking/packing | 30–50 fc | Floor level |
| Manufacturing – general | 30–50 fc | Bench height |
| Corridors / hallways | 5–10 fc | Floor level |
The gap between poor lighting and proper lighting can be huge. At Titan Distributors, a warehouse retrofit increased aisle illuminance from 6 fc to 46 fc and open areas from 15 fc to 50 fc. On the flip side, too much light burns energy for no good reason. At the Washington Navy Yard, some offices were operating at 80–100 fc even though industry standards were around 50 fc. By right-sizing illuminance, the site cut annual lighting energy use by 37.5%.
That’s why it’s smart to ask for IES photometric files and a calculated foot-candle layout. Those documents show whether the fixture will deliver the light you need at the task plane, not just on paper.
The first four metrics tell you what a fixture gives you on day one. L70 tells you how long it keeps doing that.
L70 is the number of operating hours until a fixture drops to 70% of its initial lumen output. LEDs usually dim over time instead of failing all at once, and that 30% drop can be enough to push light levels below the target set in the design.
That’s a big shift from older lamp types. Fluorescent and metal halide products were usually judged by rated life - the point when 50% of lamps had failed outright. LEDs don’t usually die that way. They fade. So when you’re comparing fixtures or trying to plan for replacement cycles, L70 is the more useful number.
To make L70 easier to use, convert the hours into years based on how long the space runs each day.
| Daily Run Time | Annual Hours | Years to L70 (50,000 hrs) | Years to L70 (100,000 hrs) |
|---|---|---|---|
| 8 hrs/day (office) | 2,920 | 17 years | 34 years |
| 12 hrs/day (retail/warehouse) | 4,380 | 11.4 years | 22.8 years |
| 24 hrs/day (industrial/parking) | 8,760 | 5.7 years | 11.4 years |
For sites that run 16 to 24 hours a day, aim for L70 ratings of 75,000 to 100,000 hours. In those settings, longer life cuts maintenance interruptions and lowers access costs. If you’re dealing with offices that run 10 to 12 hours on weekdays, 50,000 hours is often enough and will often last longer than the lease term.
Don’t stop at the headline claim on the spec sheet. Check the L70 number against LM-80 data and TM-21 extrapolation. And make sure the warranty lines up with the life claim. A 5-year warranty next to a 100,000-hour rating, with usage at 10,000 hours per year, doesn’t line up very well.
Next, compare these ratings against typical spec-sheet ranges.
Once you know what each metric tells you, the next step is simple: know the numbers worth checking first. The table below gives you a fast screening guide for U.S. commercial spec sheets. Think of these as first-pass targets, not hard rules.
| Metric | Common Commercial Benchmark | Rule of Thumb |
|---|---|---|
| Luminous Efficacy | 100–130 lm/W (standard commercial); 130–150+ lm/W (high-performance) | Below 90 lm/W usually signals poor efficiency. |
| CRI | 80–84 (general commercial); 90+ (color-critical spaces) | 80 for offices and warehouses; 90+ for retail, healthcare, and hospitality. |
| CCT | 3000K–3500K (warm to neutral warm); 4000K (neutral/cool); 5000K (cool/daylight) | 3500K–4000K for offices; 4000K–5000K for warehouses and industrial; 3000K for hospitality and retail. |
| Illuminance | Offices/classrooms: 30–50 fc; Warehouses (general): 10–20 fc; Warehouses (aisles/open areas): 10–30 fc; Retail: 30–70 fc; Parking: 1–10 fc | Maintained foot-candle targets at the workplane - not raw fixture output. |
| L70 Lifetime | ≥50,000 hrs (standard); 75,000–100,000+ hrs (heavy-duty/industrial) | 50,000 hrs for offices; 75,000 hrs or more for long-hour spaces. |
A couple of quick takeaways help here.
That last part matters. A fixture can look good in one area and fall short in another. High efficacy might come with weaker color quality. A long L70 lifetime might not help much if the CCT is wrong for the space.
Next, compare these benchmarks against each other, because no single fixture comes out on top in every metric.
The ranges above tell you what to screen for. This section is about how to rank the tradeoffs. One metric doesn't decide every project. The right fixture is the one that balances efficacy, color quality, appearance, and life for the space. The job isn't to max out one number. It's to pick the right mix for the application.
Start with the space type. Warehouses usually put efficacy and L70 near the top. Offices tend to care more about CRI and CCT. Retail often gives up a bit of efficacy to get higher CRI and a warmer CCT. After that, look at the controls, because they change how the fixture performs in day-to-day use.
Controls can shift what you should expect from a lighting system. Occupancy sensors, dimming, and daylight harvesting cut annual run time, lower energy use, and extend calendar life. They also change the effective value of efficacy and L70 once the system is in the field. Dimming can reduce thermal stress on the LEDs and the driver, which may help the system last longer in practice. Daylight harvesting can keep desks at 30–50 fc while dialing output down when sunlight is doing part of the work. In one deep-plan office study, combined control strategies approached ~70% total lighting energy savings when occupancy sensing, daylight harvesting, and personal dimming were layered together.
High-end trim matters too. It sets a new fixture's maximum output to 80%–90% of rated output, which helps cut heat and glare while still hitting the target foot-candles.
If two fixtures look close on paper, use a few practical tiebreakers:
Luminate Lighting Group uses weighted scorecards in retrofit proposals to rank fixtures by space type, showing clients exactly why a recommended fixture is the best fit for that space. Before you choose, rank the final options with a weighted scorecard.
Five metrics - luminous efficacy, CRI, CCT, delivered lumens and illuminance, and L70 lifetime - give you a clear way to judge commercial lighting fixtures. Taken together, they help you weigh energy use, visual quality, and maintenance cost.
But no single metric gives you the whole picture. Choosing fixtures by wattage or initial lumens alone can backfire. A fixture might use less power on paper, yet still fall short because of poor color quality, low task-plane light, or fast lumen depreciation.
When you're comparing fixtures, it helps to follow a simple sequence. Start with the CRI and CCT the space calls for. Then compare efficacy. After that, check delivered light with photometric data. Finally, look at L70 and the warranty. The point is to review all five together, not in isolation.
That technical fit also affects long-term costs. Higher efficacy and a longer L70 can cut kWh use and reduce maintenance labor. In some cases, qualifying fixtures may also support utility rebates and Section 179D deductions.
For multi-site portfolios or phased upgrades, these five metrics can serve as a standard evaluation framework. They make it easier to benchmark existing fixtures, spot the weakest areas first, and stay in step with U.S. energy codes and incentive programs. For organizations that want help putting this framework to work, Luminate Lighting Group uses it to plan LED upgrades for warehouse, industrial, office, and municipal projects.
Prioritize luminaire efficacy first. In commercial spaces, it gives you a more realistic view of fixture performance because it accounts for energy losses across the whole lighting system, not just the LED chip.
When you compare total lumens to power use, you get a clear read on energy efficiency, lighting quality, and long-term operating costs. It’s also a practical starting point for audits and upgrades.
Use standardized, laboratory-grade testing and measurements. Ask for independent photometric and electrical test results that align with IES LM-79 and ISO/IEC metrology practices, and confirm the lab is qualified to ISO 17025.
For on-site verification, measure illuminance at task height with a calibrated light meter in foot-candles. Then check actual wattage with a true RMS power meter or clamp meter instead of relying on nameplate specs. Document the test conditions and compare the results against IES guidance and code targets.
CRI 90+ is worth the extra cost when you need more accurate color for color-sensitive work, like quality control or color matching. It also makes sense when clearer color distinction helps with safety, such as reading safety signs, spotting hazard labels, or identifying color-coded wiring.
For most general storage areas, a CRI of 70–80 is usually enough.


