.svg)
Reduce lighting use 30–60% by pairing LEDs with IoT controls—occupancy sensors, daylight dimming, scheduling, commissioning, and monitoring.

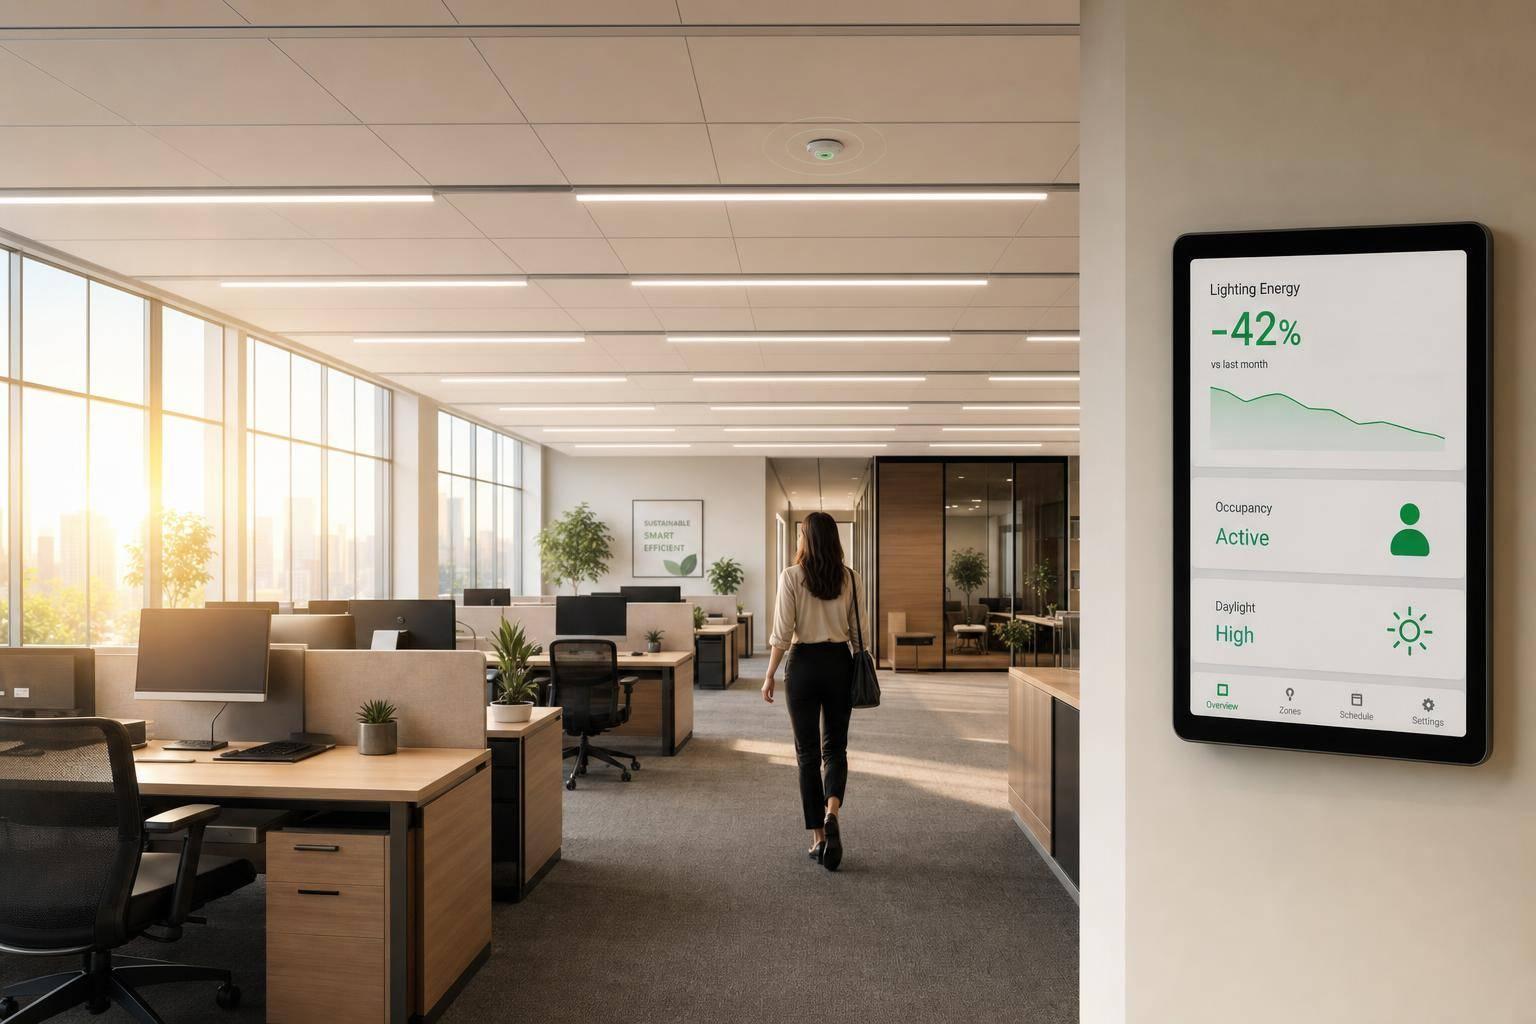
I can cut lighting energy use by 30% to 60% in many commercial buildings when I pair LEDs with connected controls, tune the settings, and keep checking the data. Since lighting uses about 17% of electricity in U.S. commercial buildings, waste from empty rooms, bad schedules, and overlit spaces adds up fast.
Here’s the short version:
A few numbers stand out:
If I had to boil the whole article down to one point, it’s this: IoT lighting cuts waste by making lights respond to people, daylight, and actual building hours instead of running the same way all day. The rest comes down to picking the right zones, setting the controls right, and checking performance over time.
IoT Lighting Controls: Energy Savings by Strategy
Start with 12 to 36 months of utility bills. Then estimate annual lighting use with this formula: fixture watts × fixture count × annual operating hours ÷ 1,000. Once you have that number, multiply it by your local electricity rate ($/kWh) to estimate annual lighting cost.
That gives you a baseline. And that baseline matters because it shows where lighting is burning the most power, so you can go after the biggest waste first.
Walk through each zone in the building and document what you find. Record:
For each space - conference rooms, warehouse aisles, corridors, parking areas, and perimeter offices - note the usual daily and weekly operating hours. If those hours are unclear, use a 2- to 3-week data logger in a representative space.
As you move through the building, look for control issues that waste energy. Common ones include lights running when no one is there, sensors turned off because they shut lights down at the wrong time, schedules that don’t match shift changes or holidays, and daylight zones that fail to dim as they should.
These notes do more than fill out a spreadsheet. They shape the scope of your IoT lighting project.
Use what you find to rank spaces by wasted hours and daylight exposure.
Some spaces are simply better targets than others. Focus first on areas with variable occupancy, high daylight exposure, or long operating hours, such as conference rooms, warehouse aisles, perimeter offices, and exterior lighting.
Exterior lighting often stands out here. It’s commonly tied to fixed nighttime schedules, which means there’s room to cut waste through better scheduling, dimming, and occupancy-based control.
Luminate Lighting Group can formalize the baseline with fixture inventory, photometric review, and energy analysis, while also pointing out rebate-eligible upgrades in warehouses, industrial spaces, offices, and municipal facilities.
Use your baseline to match each control to the areas that waste the most energy. That's how audit data turns into actual kWh savings.
Focus first on spaces with the most wasted operating hours, the most daylight, or the most uneven occupancy. A control only pays off when it fits the way the space is used.
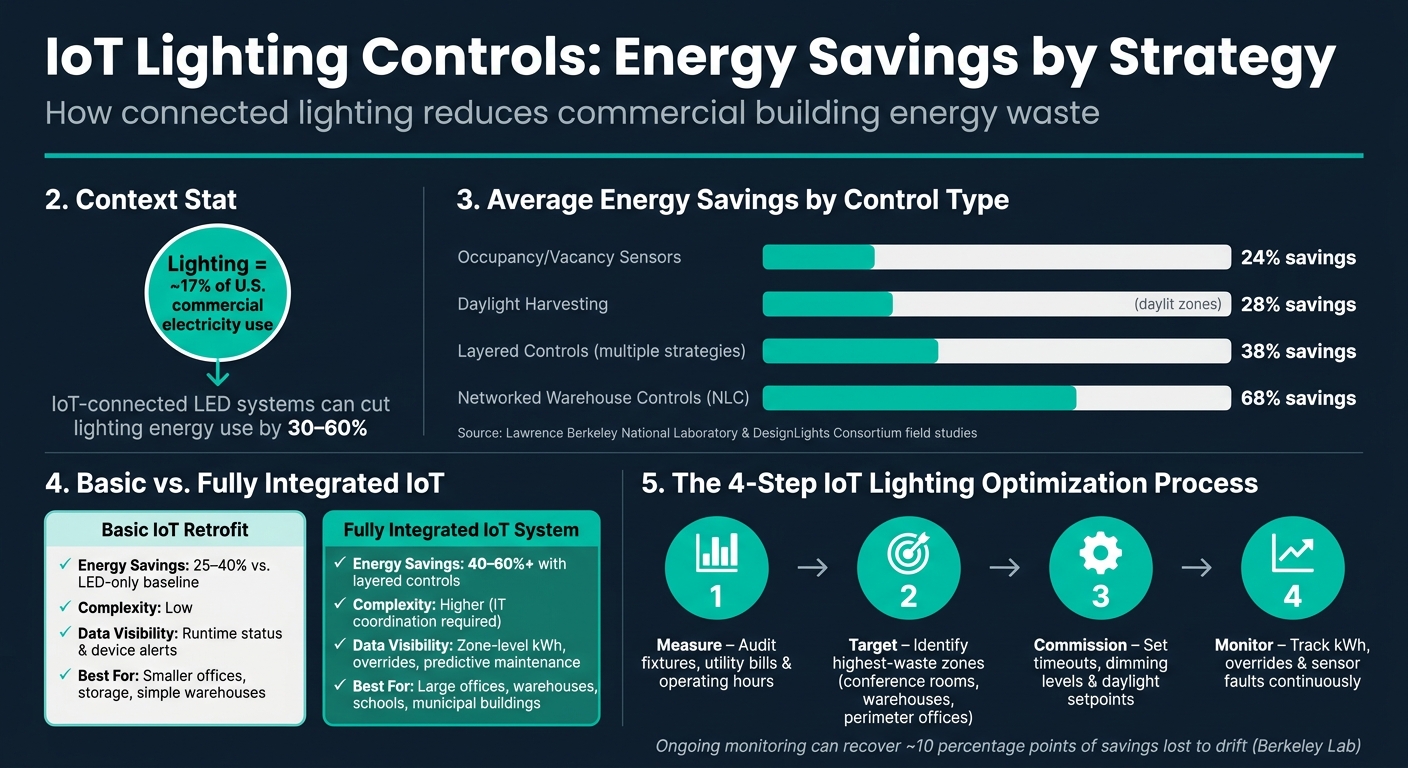
Occupancy sensing turns lights off or dims them when a space is empty. It works well in rooms with uneven use, like restrooms, storage rooms, copy rooms, and conference rooms. Use vacancy sensing in places where manual-on helps cut unwanted activations. A Lawrence Berkeley National Laboratory meta-analysis found that occupancy controls deliver average lighting energy savings of 24%.
Time-based scheduling works best for spaces with set hours. Lights can ramp up before the workday begins, stay at normal levels during business hours, and step down after closing. Add a holiday calendar too, so lights don't stay on during holidays or planned shutdowns.
Daylight harvesting dims electric lighting as daylight increases. It's a strong fit for perimeter offices, classrooms near windows, and warehouse bays with skylights. Keep daylight zones separate from interior zones so perimeter fixtures can dim without affecting interior lighting. LBNL data shows daylight harvesting delivers average savings of 28% in daylit zones.
Once the zones are set, the next move is simple: cut excess output so the system saves power without leaving the space too dark.
After an LED retrofit, it's common for fixtures to produce more light than the space needs. High-end trim fixes that by capping the top output of each fixture, often at 70% to 80% of full power. In plain English, the lights never run above the level the space actually needs.
Task tuning takes that a step further by setting light levels by area. Corridors and break rooms can run lower. Detailed workstations or picking aisles can stay higher.
Set high-end trim during commissioning. Measure workplane footcandles, then lower maximum output until light levels meet code and task needs. LBNL data puts average savings from institutional tuning at 36%, and 38% when multiple strategies are used together.
With the control logic in place, make sure it matches both code and day-to-day building use. Otherwise, savings can slip after commissioning.
IoT control sequences need to line up with building operations and U.S. energy code rules. ASHRAE 90.1 and the International Energy Conservation Code (IECC) call for automatic shutoff in most commercial spaces, occupancy or vacancy controls in certain room types, and daylight-responsive controls in defined daylit zones. For instance, ASHRAE 90.1-2022 requires lighting to shut off automatically within 20 minutes after all occupants leave a space.
| Control Strategy | Best-Fit Spaces | Code Requirement Met |
|---|---|---|
| Occupancy sensing | Restrooms, storage rooms, classrooms, conference rooms | ASHRAE 90.1 / IECC automatic shutoff |
| Vacancy sensing (manual-on) | Private offices, small support rooms | ASHRAE/IECC manual-on provisions |
| Time scheduling + holiday calendar | Whole buildings, campuses, predictable hours | ASHRAE/IECC automatic shutoff baseline |
| Daylight harvesting | Perimeter offices, skylit bays, windowed classrooms | ASHRAE/IECC daylight zone requirements |
| High-end trim / task tuning | Post-LED retrofit spaces across all types | Reduces overlighting while maintaining required light levels |
A written design intent document that links each IoT feature to the exact code paragraph it satisfies can make commissioning and inspection much smoother.
Once your control plan is set, it's time to put it into action. A phased rollout helps keep disruption low, gives you room to spot issues early, and helps your team get comfortable before you scale. After the controls are selected, commissioning is what turns that setup into verified savings.
Begin with the highest-waste zones you flagged in Step 1. Run a 60–90 day pilot in 1–3 zones before expanding.
A DesignLights Consortium (DLC) field study covering more than 100 sites found that warehouses using networked lighting controls (NLCs) delivered average lighting energy savings of about 68%, with some sites hitting 75–88%.
That pilot period gives you a chance to catch problems before a building-wide rollout. Track the results, then use what you learn to fine-tune the next set of zones.
Hardware by itself doesn't cut kWh. Poor or incomplete commissioning is one of the main reasons IoT lighting projects fall short, even when the fixtures and sensors are a good fit.
Before installation starts, confirm that the LED drivers support the planned control protocol, whether that's 0–10V, DALI, or a manufacturer-specific wireless standard. Also make sure sensors, gateways, and luminaires can all communicate on matching platforms.
The settings are where the savings show up. Timeout windows, dimming behavior, and daylight response are what turn connected hardware into measured results. During commissioning:
After programming, test every zone. Walk the space. Trigger sensors. Confirm scheduled events happen at the right times. Check that the dashboard is logging data the way it should. One commissioning guideline recommends testing at least 10% of occupancy sensor controls, with full testing required if more than 30% of that sample fails.
Record every setting in the IoT platform, including timeout delays, trim levels, daylight setpoints, and schedule names. That way, when you expand into similar spaces across the building or across a portfolio, you can reuse settings that already worked.
Not every facility needs the same setup. Some buildings do fine with a simpler retrofit. Others need deeper visibility and tighter control. Here's how a basic IoT retrofit compares with a fully integrated system on the points facility and finance teams usually care about most.
| Factor | Basic IoT Retrofit | Fully Integrated IoT System |
|---|---|---|
| Expected energy savings | 25–40% vs. LED-only baseline | 40–60%+ through layered occupancy, daylight, trim, and adaptive scheduling |
| Implementation complexity | Low; minimal IT involvement | Higher; requires detailed design, IT coordination, and commissioning |
| Data visibility | Runtime status and device alerts | Zone-level kWh, peak demand, override logs, asset health, and predictive maintenance |
| Maintenance benefits | Alerts for failed devices or offline sensors | Centralized firmware updates, driver failure trends, remote configuration changes |
| Best fit | Smaller offices, storage areas, straightforward warehouse layouts | Large offices, multi-level warehouses, industrial plants, schools, and municipal buildings |
| Rebates and Section 179D documentation | Limited data; manual reporting needed | IoT-generated performance reports support utility rebates and Section 179D packages |
The commissioning data from these zones becomes the performance baseline for Step 4.
After commissioning, IoT data helps keep lighting savings on track. It shows drift, faults, and weak settings early, before they quietly eat into performance.
Once commissioning is done, dashboard data tells you if the system is still working the way it should. Track kWh by zone, occupied and unoccupied runtime, override rate, schedule adherence, and fault alerts.
Repeated overrides are usually a sign that something is off. In many cases, schedules start too early, end too late, or dimming is set too low for comfort. A small tweak to timeouts or light levels can bring comfort back without giving up savings.
Driver faults and offline sensors should be treated like maintenance issues, not minor glitches. If they go unchecked, fixtures can get stuck at full output and wipe out part of the energy savings.
A Berkeley Lab field evaluation found that actual installed savings were roughly 10 percentage points lower than simulated savings across control types. That gap matters. Ongoing monitoring helps close it because it points to the exact zones and settings where performance has slipped.

The same trend logs can also support rebate and tax documentation. Keep interval data, occupancy logs, and control records organized from day one. Utility rebates and Section 179D reviews often ask for that proof. So the system isn't just helping with day-to-day operations. It's also helping with reporting.
Luminate Lighting Group can align audits, control narratives, and post-installation trend data with rebate and Section 179D documentation.
IoT lighting delivers the most value when teams set a baseline, tune controls, commission with care, and keep reviewing data. If no one checks performance over time, savings can drift as occupancy patterns and schedules change.
Data helps only when someone looks at it, responds to alerts, and makes periodic adjustments as building operations shift. Facilities that use IoT data for continuous tuning are better positioned to preserve savings over time and sustain performance in the range reported in large networked lighting controls studies.
IoT lighting systems can cut lighting energy use by 30% to 75% in many facilities. On average, networked lighting controls save about 49%.
Those savings usually come from a few simple functions working together: occupancy sensing, daylight harvesting, and scheduling. The exact result depends on the building and how it’s used, but in some cases, these systems can deliver ROI in as little as 45 to 60 days.
Spaces with long hours, shifting occupancy, and large open floor plans tend to get the most from IoT-enabled lighting controls.
That includes warehouses, industrial facilities, offices, municipal buildings, conference rooms, and storage areas. In these settings, sensors and automated lighting changes can cut energy use by responding to activity, foot traffic, and available daylight.
Commissioning makes sure your lighting system works the way it should and delivers the energy savings you expect. It checks that control zones, sensors, and programming all perform properly in day-to-day use and meet energy code rules.
It also sets baseline settings for peak efficiency and makes future maintenance and inspections easier. When paired with user training, proper commissioning helps stop waste caused by smart lighting controls that are set up the wrong way.


