.svg)
IoT monitoring with LED retrofits and lighting controls cuts building energy 10–80%, verifies savings, and shortens payback.

Yes - IoT energy monitoring can cut utility costs, and the payoff is often strongest when I pair monitoring with LED upgrades and lighting controls. Across the research in this article, whole-building savings often land in the 10% to 30% range, while lighting projects can reach 60% to 80% in some cases when controls are added.
If I strip it down to the main point, it’s this:
A few numbers stand out right away:
Here’s the simple takeaway: if you want better ROI, don’t look at monitoring as a dashboard alone. The better path is monitored retrofits with controls, measured over time, with incentives built into the math from day one.
| Approach | What I get | Reported savings |
|---|---|---|
| Monitoring only | Better visibility into waste | Whole-building 10%–30% |
| Occupancy sensors only | Lights off when spaces are empty | 23.2%–37.9% |
| LED retrofit only | Lower lighting energy use | 21%–39% in schools; often higher in other studies |
| LED + controls | Lower use plus automatic shutoff/dimming | Up to 60% or more |
| Networked lighting controls | Measured zone-level performance | Often 60%–80% lighting savings |
If I’m deciding whether a project is worth the spend, these are the numbers and conditions that matter most.
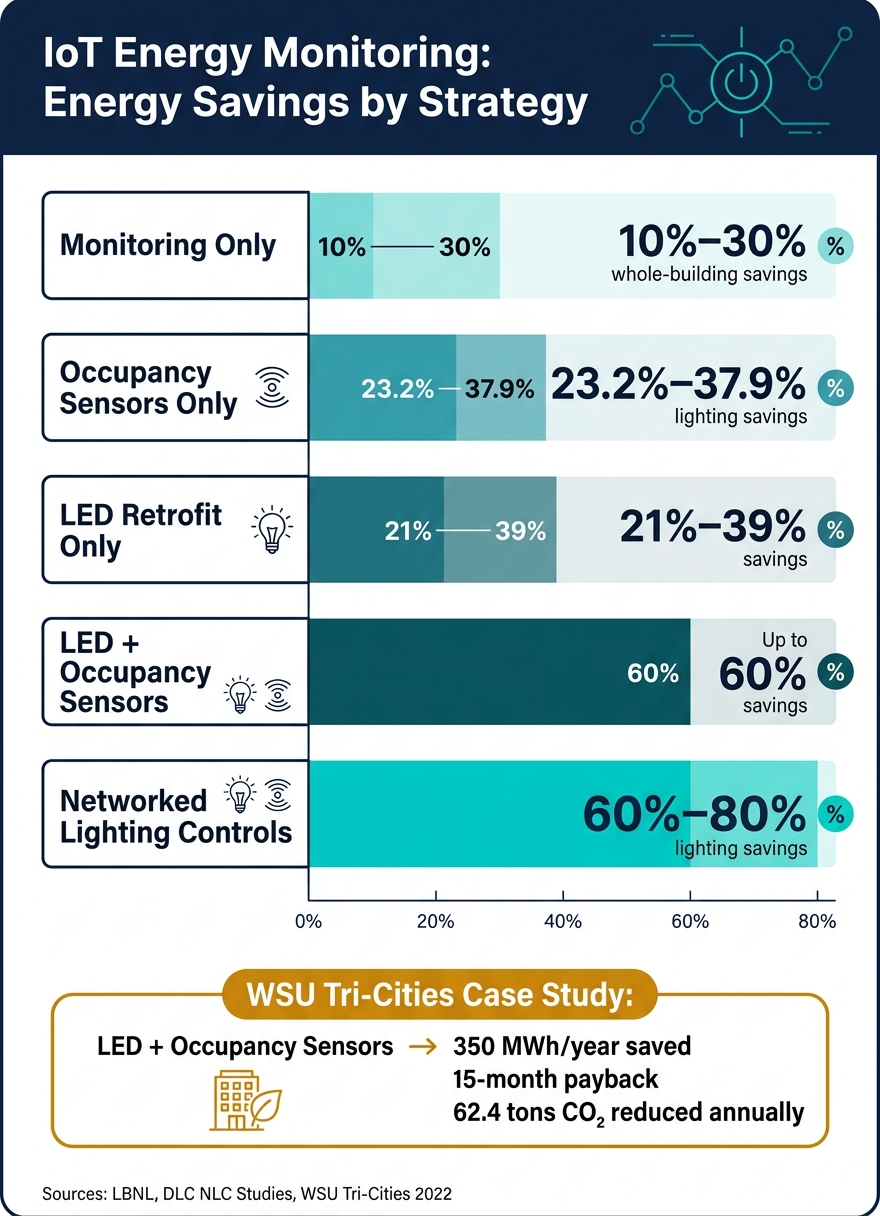
IoT Energy Monitoring: Savings by Strategy
Studies in the field and review papers point to 10%–30% whole-building energy savings from real-time IoT monitoring and analytics. That drop in energy use can speed up payback because monthly utility costs go down. In many buildings, lighting shows gains first, since occupancy data can trigger control changes right away.
A lot of waste is pretty mundane: lights left on after hours, HVAC running when no one is there, or schedule mistakes that sit unnoticed between audit cycles.
Lighting stands out as one of the biggest chances to cut waste. In typical office spaces, occupancy sensors alone can reduce power use by 23.2% to 37.9%. And when you pair monitoring with retrofit work, the return becomes easier to measure.
A good example comes from a 2022 Washington State University Tri-Cities case study. In the 134,000-square-foot Floyd and East buildings, researchers found that LEDs plus occupancy sensors could deliver 60% energy savings, or 350 MWh a year, while cutting CO2 emissions by 62.4 tons each year.
Here’s how the reported savings change based on the mix of technologies:
| Strategy | Reported Energy Savings Range |
|---|---|
| Occupancy sensors only (office spaces) | 23.2% – 37.9% |
| LED retrofit only (schools) | 21% – 39% |
| LED retrofit + occupancy sensors | Up to 60% |
These savings tend to last better when the system keeps tracking performance after the retrofit is done. Periodic audits give you a snapshot. Real-time monitoring gives you a live feed.
That difference matters. Continuous data can spot faults, odd energy use, and schedule drift as they happen, not weeks or months later. It also helps keep control settings tuned so the savings continue over the life of the project.
Lighting retrofits show the clearest tie between monitoring and ROI.
LED retrofits usually cut lighting energy use by 37% to 63%. Add networked controls, and savings often move up to 60% to 80%. A 194-building study found 49% average savings from networked controls and 63% from luminaire-level controls. Some building types did even better, with warehouses at 68% and offices at 64%.
A Lawrence Berkeley National Laboratory meta-analysis breaks this down even more. Occupancy sensing by itself averages 24% savings. Daylighting controls average 28%. Personal tuning comes in at 31%, and institutional tuning reaches 36%. When these tactics are combined through a networked system, the average climbs to 38%, and some projects hit 80%.
That gap matters. Swapping fixtures saves energy, but controls help trim waste that plain LEDs can't touch, like lights left on after hours or overlit zones during the day.
Those savings only count if the system keeps proving them after installation.
Zone-level monitoring helps teams catch sensor failures, schedule overrides, and after-hours runtime before savings start slipping. Fixture-, circuit-, or zone-level monitoring gives interval data, often in 5- to 15-minute intervals, so you can see exactly how much energy each zone uses and when. The DLC NLC studies looked at more than 1,200 zones and used 60+ days of interval data per building. That made it possible to measure actual savings with confidence instead of leaning on modeled assumptions.
In day-to-day use, this data does a few jobs at once:
LBNL validation work has also found that energy monitoring from certain NLC systems is accurate enough to use directly for savings evaluation.
This also matters for project paperwork. Many utility rebates and Section 179D deductions require interval data, and IoT-monitored systems can produce it automatically.

Project design and documentation play a big role in whether projected savings show up on the utility bill.
Luminate Lighting Group supports LED retrofits, custom lighting design, energy audits, and the documentation needed to connect measured savings to rebates and Section 179D deductions.
After you confirm the savings, the next step is simple: how long until the project pays for itself? At Washington State University Tri-Cities, monitored LED tubes and occupancy sensors reached a 15-month payback. That’s fast, and it shows why it’s smart to build the full ROI model before locking in the project scope.
A good ROI model separates upfront capital costs from recurring operating costs. If you lump them together, the numbers can get distorted.
On the savings side, include:
Higher first cost doesn’t always mean worse long-term results. In many cases, total life cycle cost tells you far more than the purchase price alone.

Incentives can cut the payback period even more by lowering the net project cost. Washington State's Clean Buildings bill (HB 1257), for example, offers a minimum of $0.85 per square foot for buildings over 50,000 square feet that meet energy intensity targets early. That can have a direct effect on project economics.
Section 179D can also improve returns for qualifying commercial buildings through tax deductions.
Across the studies reviewed, IoT-enabled monitoring reliably cuts energy use and cost in commercial buildings. The biggest gains tend to show up when monitoring is paired with controls or LED retrofits. Put simply, the pattern is clear: IoT monitoring improves ROI by cutting waste, checking that savings are happening, and helping retrofits keep doing their job over time.
Payback is often short enough to fit standard capital planning windows, especially for lighting projects that include controls. That matters for budget approval. But the bigger story is what happens after installation. Long-term returns depend on stopping savings from slipping away, and continuous monitoring does a better job than periodic audits because it keeps spotting faults, schedule drift, and after-hours waste after the retrofit is done.
For lighting, IoT-connected controls add another layer of savings and help maintain performance over time. That’s why implementation support matters. Luminate Lighting Group supports this work by integrating LED retrofits, controls, audits, and rebate and 179D documentation for commercial, industrial, and municipal clients. Rebates and Section 179D should be built into every ROI model because they can improve net project returns in a meaningful way.
Calculate ROI by weighing implementation costs against the money you get back through energy savings, lower maintenance costs, and tax incentives.
Start with a baseline. You can do that with an energy audit or by pulling real-time usage data. Then compare energy use before and after installation to see what changed.
Using the IPMVP can help verify savings when you're applying for utility rebates and 179D tax deductions, which can shorten payback periods.
Buildings with high-impact energy systems - especially lighting-heavy warehouses, industrial plants, and office buildings - usually see the fastest payback.
When you pair IoT-enabled energy monitoring with focused LED retrofits, the numbers can move fast. Utility rebates and 179D tax deductions can reduce upfront costs by up to 50%.
That means payback often lands in under two years. In some well-optimized projects, ROI can show up in just 45 to 60 days.
To verify energy savings, start with a baseline of energy use before the upgrade. Pull that from utility bills, energy audits, and the current loads of your equipment.
After installation, track performance with IoT sensors and sub-meters. That gives you real-time interval data across zones, circuits, or specific equipment.
For results people can trust, follow recognized protocols like IPMVP. You also need to factor in occupancy, seasonal weather, and operating hours, since those can change energy use even when the equipment stays the same.
Keep your paperwork organized, too. Save equipment specifications, invoices, and certified energy analyses.


