.svg)
Measure work‑plane light with a calibrated meter, use grid-based readings, check uniformity, and document results for compliance and audits.

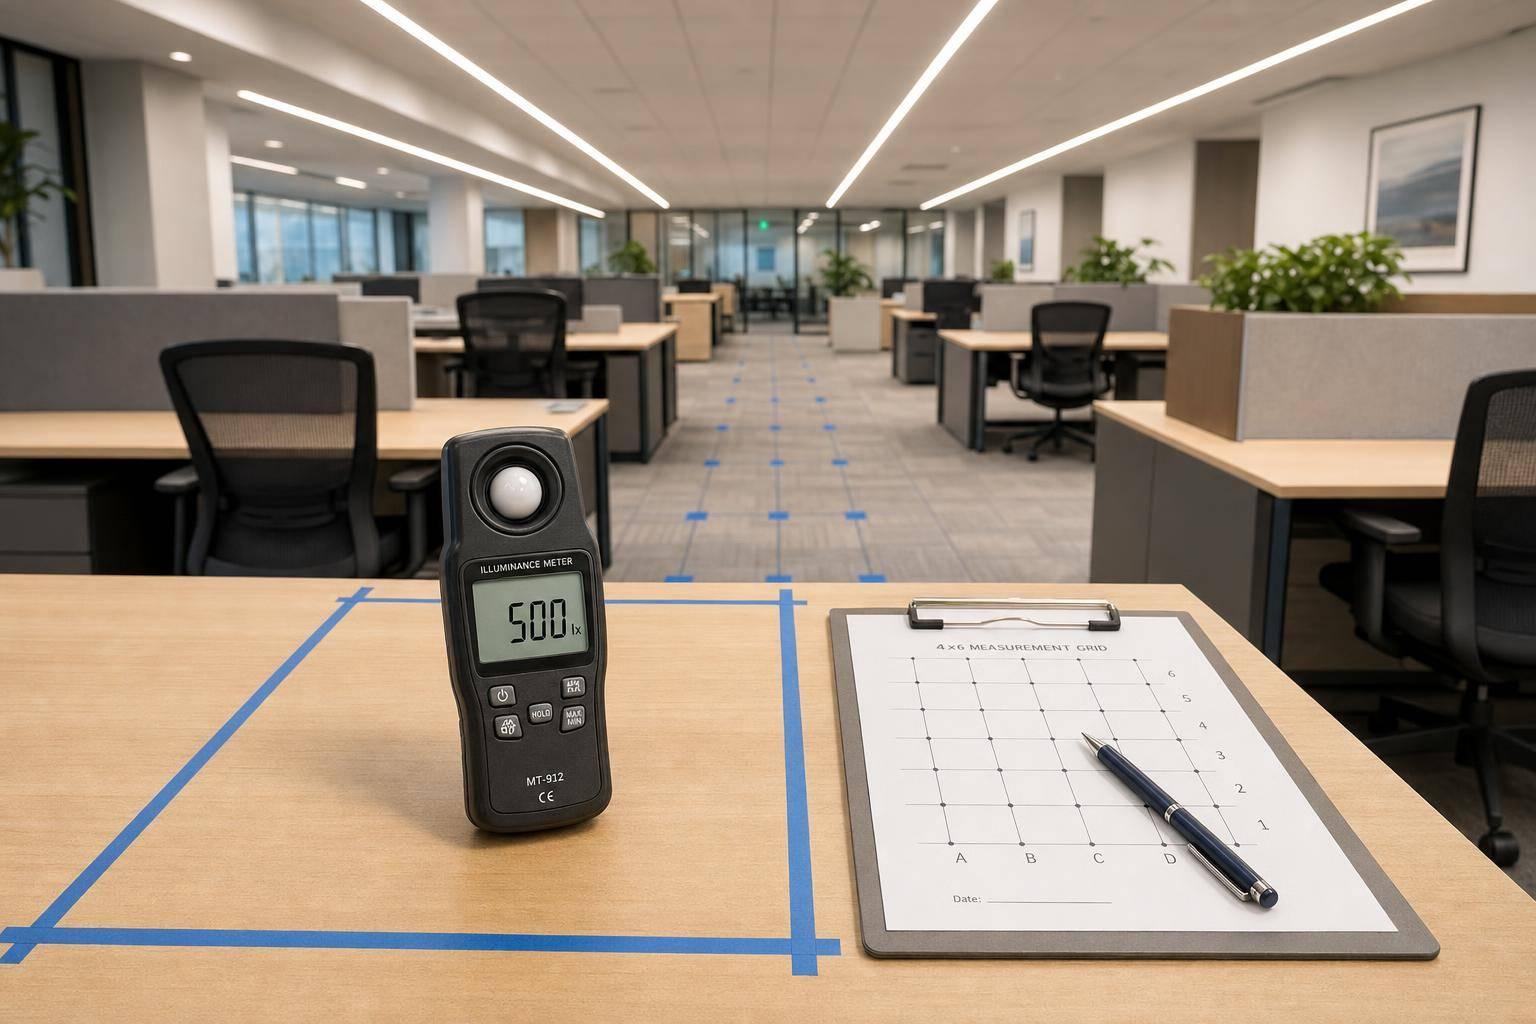
If you want lighting data you can trust, I’d do four things: set a target, measure on a grid, check average and uniformity, and compare the results to OSHA, IES, and the lighting plan.
That’s the whole job in plain terms. I’m not measuring how bright a fixture looks overhead. I’m measuring how much light lands on the work surface, floor, or rack face. In the U.S., that usually means foot-candles, while many product files still use lux. And yes, 1 foot-candle = about 10.76 lux.
Before I start, I want a few things locked in:
A few numbers matter right away:
Here’s the short version: if I skip the grid, use the wrong measurement height, or ignore vertical light in racking, the results can look fine on paper and still miss the task. That’s where lighting audits go wrong.
So in this guide, I’d focus on the simple process that works: pick the target, take clean readings, check the spread of light, and document the results in a format an inspector or auditor can follow fast.
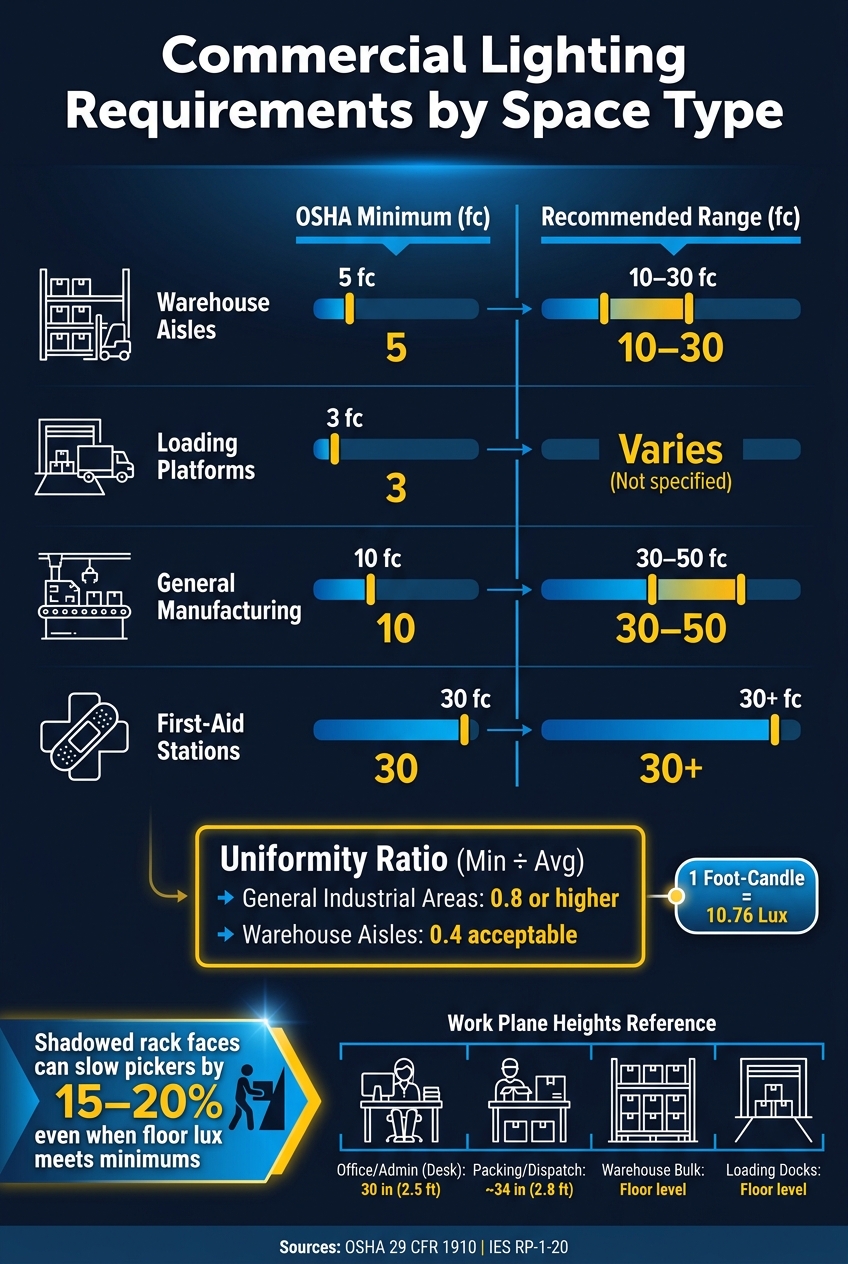
Commercial Lighting Standards: OSHA Minimums vs. Recommended Foot-Candles by Space Type
Once you’ve set your target levels, get your meter ready and decide exactly where you’ll measure.
For field readings, use a calibrated digital lux or foot-candle meter. If the readings are for OSHA checks or utility rebate paperwork, use a professional-grade calibrated meter with a current certificate. The sensor should also be cosine-corrected, which helps the meter read light from off angles the right way. On big sites, features like data logging and auto-ranging can save a lot of time.
Use a calibrated meter. Smartphone apps are not suited for compliance work or audit-grade readings.
Photometric software is also part of the setup. Use it to build grid layouts, run simulations, and compare modeled results against field readings.
Run the lighting system in its normal mode and give the fixtures time to warm up before taking readings. You should also note whether daylight is part of the measurement. For baseline electrical audits, leave daylight out.
Next, define the work plane. That simply means the surface where the task happens. The right measurement point changes by space type:
| Space Type | Primary Work Plane | Common U.S. Height |
|---|---|---|
| Office / Admin | Horizontal (Desk) | 30 inches (2.5 ft) |
| Packing / Dispatch | Horizontal (Task Surface) | ~34 inches (2.8 ft) |
| Warehouse (Bulk Storage) | Horizontal (Floor) | Floor level |
| Warehouse (Racked) | Vertical (Rack Face) | 20 inches to 40 feet |
| Loading Docks | Horizontal (Floor) | Floor level |
In racked warehouses, floor readings by themselves can miss what matters. You also need vertical illuminance at the rack face, because that’s where people read labels and scan barcodes.
Set up an even rectangular grid across the whole space based on the floor plan. One reading in the center won’t tell you much about uniformity.
Before measuring, record the setup details that shape the results:
Record the date, time, and control settings in U.S. format as well. Those details help you compare each reading to your target level and to later audit records.
Once your grid is set and the room conditions are written down, you can start measuring. Use a calibrated lux meter, and check the calibration date before the first reading.
Set the sensor flat on the work plane at the right height for that space. Keep it still. Then move out of the way so you don't throw a shadow over the sensor. Record the number, and use the same grid labels at each point so the results are easy to line up later.
After you’ve logged every point, work out the minimum, maximum, and average across the grid. Those three figures are what you need to calculate the uniformity ratio: minimum ÷ average. That ratio shows whether light is spread evenly or bunching up in some areas. For general industrial areas, a ratio of 0.8 or higher is recommended. For warehouse aisles, 0.4 is acceptable.
One small thing that matters more than people think: clean dusty fixtures before you measure. Dust can push readings down and throw off the whole grid.
The meter process stays the same. What changes is the surface you measure.
These field readings become the baseline for software comparison.
Use the same grid from your field survey and compare each field reading to the model, point by point. The model is built from manufacturer IES files and predicts work-plane illuminance, uniformity, and coverage for the room layout. Treat the photometric plan as the benchmark for your field readings.
When the grid points match, this side-by-side check can show dim areas and over-lit zones that waste energy. Use a photopic-corrected meter when measuring LED sources, or apply a correction factor if needed.
Once you can see the gap, you can pick the right fix instead of guessing.
After the comparison, decide whether the lighting needs changes or whether you need to document compliance.
If field readings miss the plan, adjust fixture output, mounting height, or beam optics. Then document the comparison for rebates, audits, and 179D support.
Once the grid is done, the next job is simple: turn those readings into a clear pass/fail call.
Use the average reading and U₀ to check how evenly light is spread across the space. A higher U₀ means the lighting is more even.
A low U₀ usually points to fixture spacing, mounting height, or optics, not lamp failure. So if total lumen output looks fine on paper but foot-candle readings at the work plane are still low, the problem is likely fixture optics or beam control. Re-lamping usually won't fix it. You may need fixture replacement or a layout change.
If light levels look fine but people still report eye strain or glare, check luminance (cd/m²). That gives you a better read on what occupants are actually seeing.
Once you've pinned down the problem spots, log them in a standard table.
Your documentation should be easy for auditors and inspectors to follow at a glance. Each area should have its own row with the target illuminance, measured minimum, average, and maximum values, the uniformity ratio, and a clear pass/fail result.
| Field | What to Record |
|---|---|
| Space / Zone | Office, warehouse aisle, packing station, etc. |
| Target Illuminance (fc or lux) | Based on IES RP-1-20 or OSHA 29 CFR 1910 |
| Measured Min / Avg / Max | From your grid readings |
| Uniformity Ratio (U₀) | Min ÷ Average |
| Pass / Fail | Compared to the standard for that space type |
| Notes | Glare complaints, shadows |
A solid illuminance audit follows the same core steps every time: set target light levels for each space type, use a calibrated lux meter, measure on a defined grid, and compare the results against IES and OSHA standards.
It also helps to layer in photometric software. That lets you check your field readings and spot likely fixes before spending money on hardware changes.
Use the same process for every audit:

Use a grid of measurement points across the work area to record minimum and average light levels. In photometric software, common industry practice is to space calculation points 10 to 20 feet apart.
Take several readings at a standard work-plane height of 30 inches (0.8 meters). This helps spot dark areas, glare, and uneven lighting.
Measure vertical illuminance when you need to check light on walls or faces. That helps improve visibility, communication, and the way a space feels in terms of brightness.
Horizontal illuminance is usually measured at a 30-inch work-plane height. It’s used for task visibility and compliance on desks or workbenches.
By contrast, vertical illuminance shows how light falls on vertical surfaces. That gives you a better read on balance and comfort in a lighting setup.
First, make sure your measurement setup matches the plan. Use a properly calibrated light meter and take readings at the right task height, which is usually 30 inches.
Then look at site conditions that can change light levels. Common ones include dust on lenses, wall reflectivity, obstructions, and the installed fixtures’ actual mounting heights or beam angles.


