.svg)
Use networked lighting, OpenADR/BACnet, and metering to dim zones 20–50% during peak events and cut kW without disrupting occupants.

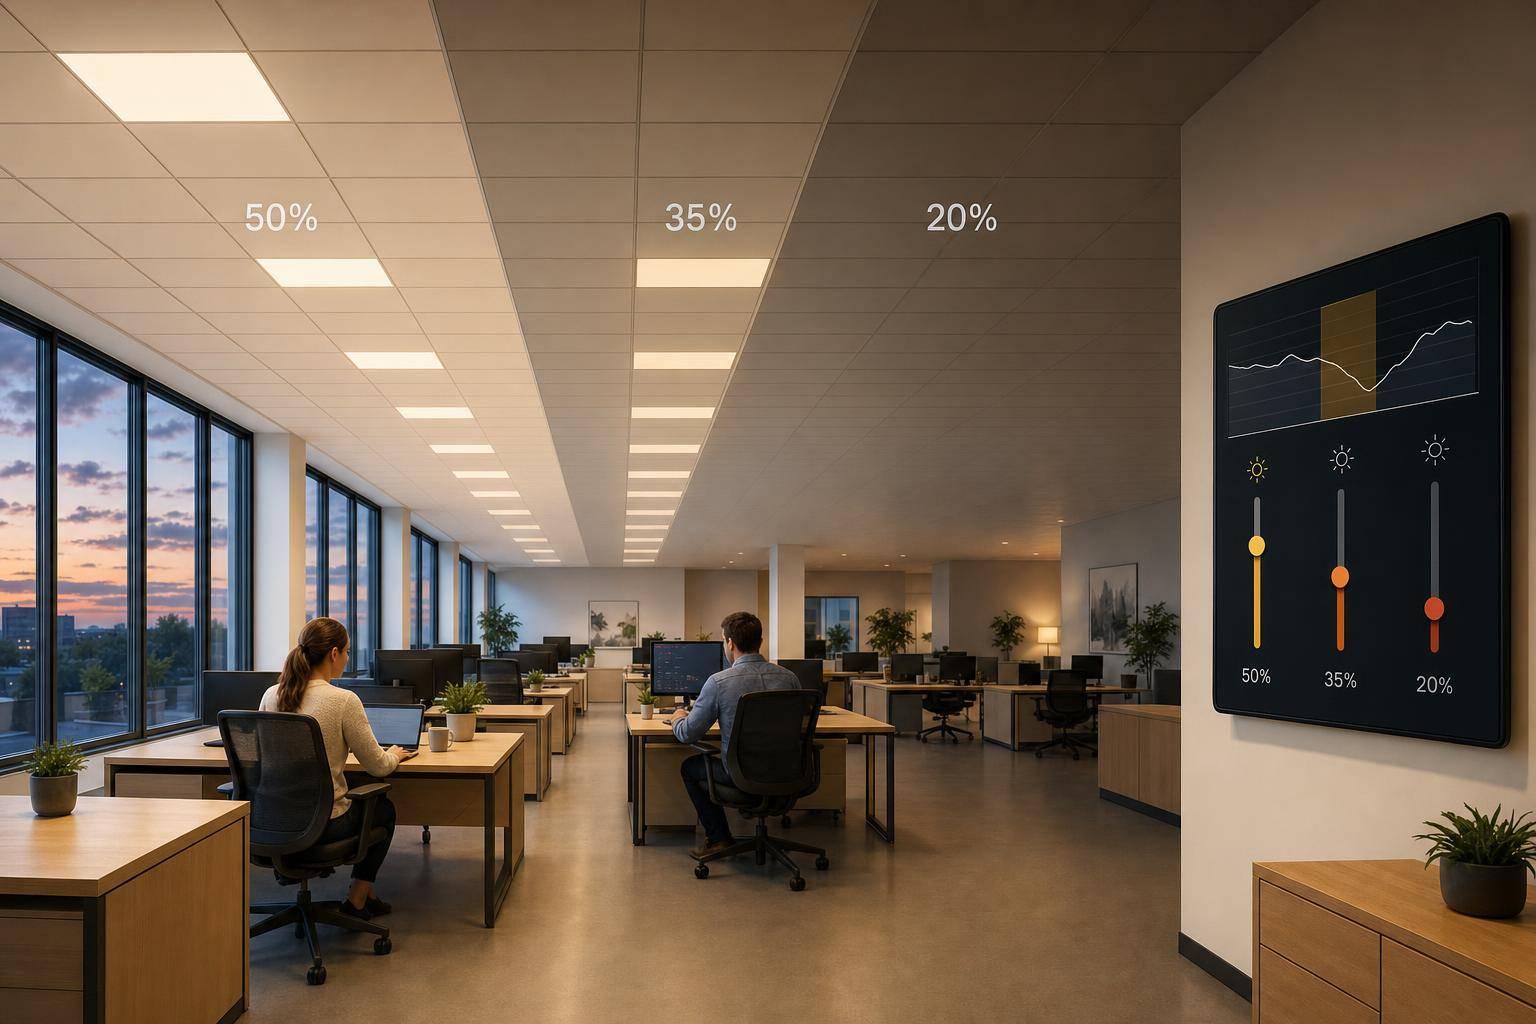
Yes - smart lighting controls can help you cut load during a demand response event without shutting down your building. In most commercial spaces, the play is simple: connect the utility signal, dim the right zones by 20%–50%, track the kW drop during the 1–4 hour event, and return lights to normal when the event ends.
If I were setting this up, I’d focus on four things first:
Here’s the core idea in plain English: LEDs lower lighting energy use every day. Smart controls let me cut that load a bit more when the grid is under stress. That matters because lighting can account for about 30%–33% of commercial peak load. So even a modest dimming plan across offices, common areas, storage, and back-of-house zones can produce a measurable drop.
What makes this work is not just the fixtures. It’s the full setup:
In other words, demand response with lighting is less about swapping bulbs and more about control, timing, and proof.
Below, I walk through the setup in a simple order: what systems I need, how I’d prep zones, how I’d program event behavior, and how I’d use event data to fine-tune the next run.
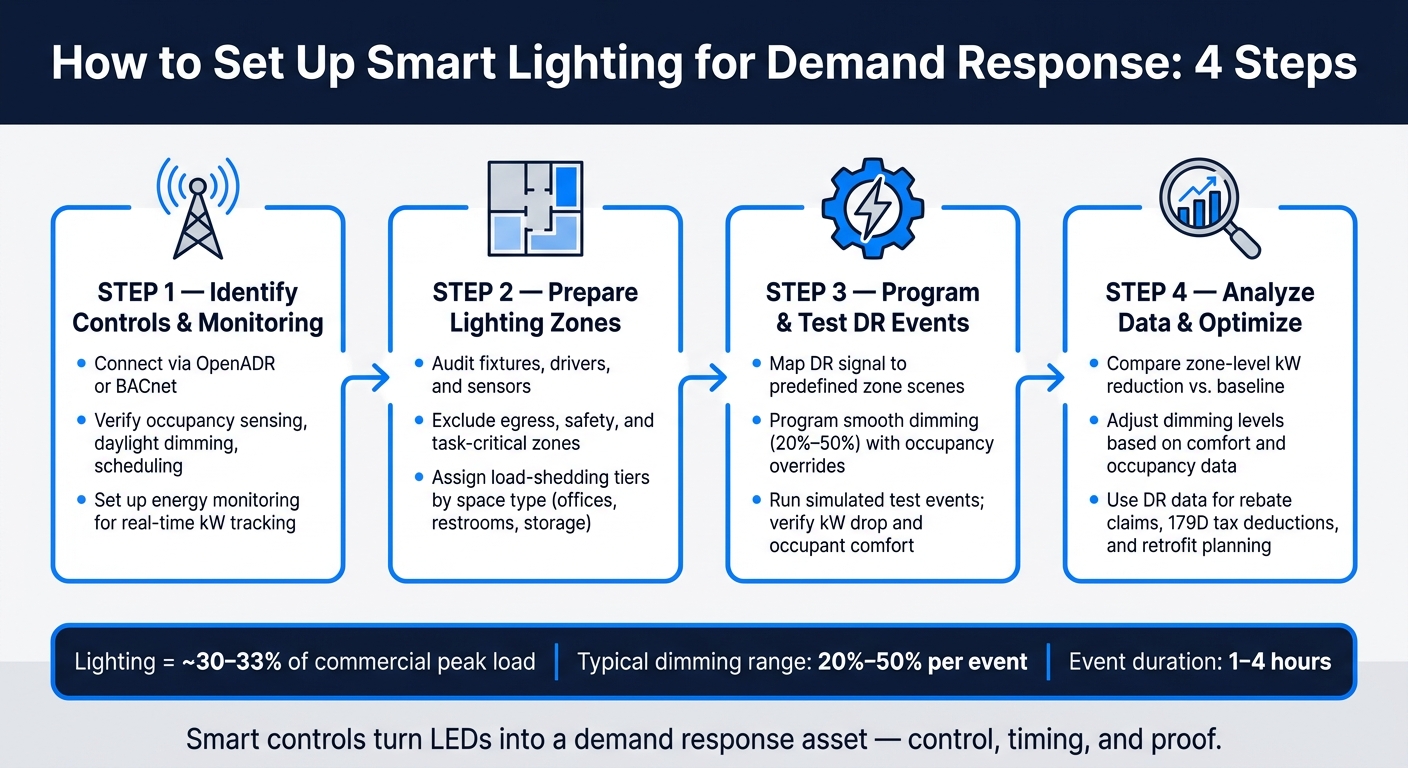
Smart Lighting Demand Response: 4-Step Setup Guide
Before a DR event can cut lighting load, you need two things: a clear way to send the control signal and a clear way to measure what changed.
Start by mapping what’s already in place. Look at the lighting controls, the signal path, and the metering setup you’ll use to check performance. If any part of that chain is missing, the DR plan can fall apart when the event starts.
A networked lighting control (NLC) system gives you the control layer for DR events. In many cases, NLCs are also required if you want access to higher utility incentive tiers and more advanced demand response programs.
For DR, put OpenADR at the front of the line for event signals and BACnet for BMS integration. Then verify that the controls can pass DR signals to and from the BMS through OpenADR or BACnet. That’s the basic handoff. No handoff, no event response.
You’ll also want to confirm support for:
These features are the building blocks of a load-shedding sequence during peak demand events.
Once the controls can receive and act on the signal, the next job is proving the result.
Controls by themselves aren’t enough. The lighting system also needs energy monitoring that tracks real-time load and event results. Without that, you’re guessing.
System-level monitoring can also show savings from high-end trim, daylight harvesting, and occupancy sensing. On top of that, lighting systems should be able to share occupancy, scheduling, and environmental data with BMS and HVAC systems, so facility teams can see how lighting affects whole-building energy performance.
Networked lighting controls now often include energy monitoring and reporting. Standardized reporting helps build confidence in measured event savings and utility verification. Focus on systems that can produce event-level measurement, baseline comparison, and post-event reporting. Those reports make it much easier to document results and support utility program requirements.
Before you set up DR programming, get the lighting system ready first. The aim is simple: each zone should react in a predictable way during an event, then go back to normal without throwing off day-to-day work.
Start with the spaces most likely to handle event load. Walk the facility and document each fixture type, driver, sensor, and control point so you can see which fixtures and zones can produce a measurable kW reduction. Check which fixtures have dimming drivers, since dimming is the starting point for demand response. Then verify whether the system is networked or standalone, and make sure it supports centralized zone control.
Mark any emergency egress paths, safety-sensitive areas, and task-critical zones that need to stay at minimum light levels or stay out of the event sequence.
After that, assign response levels based on space type. Transitional and intermittent-use areas like restrooms and conference rooms can usually handle deeper reduction. Offices, common areas, and task-critical zones should be dimmed more carefully or left out.
Don’t use one blanket setting for the whole building. Instead, write a one-line response plan for each zone that spells out:
That zone-by-zone sequence becomes the basis for programming and test events.
Make sure normal control functions work the way they should before you add DR logic. Occupancy sensors, daylight harvesting, schedules, and local wall controls all need to perform as intended. If some fixtures don’t have dimming capability, or some controllers don’t support standards like BACnet or OpenADR, fix those gaps before adding DR logic.
Now that your lighting zones have undergone a lighting audit, your tiers are set, and your normal controls are working as expected, it’s time to connect the demand response signal and decide what happens during an event.
Route the DR signal through the gateway, confirm that OpenADR and BACnet are communicating, and map each trigger to the zone scenes you set up in Step 2. Then apply the programmed dimming scene, with only occupied areas and code-required spaces staying above minimum light levels.
This is the point where the zone plan from Step 2 becomes a live DR sequence.
Program each event so light levels shift smoothly, not all at once, and keep every zone above a safe, code-compliant minimum. Use occupancy sensors to keep occupied spaces usable while letting empty zones dim more.
Set the system to return to its normal schedule on its own when the event ends. Then save the event log so you can review performance zone by zone.
Before your first live event, run a simulated test and watch the response in the EMS. Your EMS should record trend data so you can compare pre-event baseline demand with event-period use in kilowatts.
After the test, check these four points:
If a zone doesn’t respond, start with the basics: check the gateway, communication settings, and device connectivity. Save the test results for the event analysis in Step 4.
Use the event data from Step 3 to fine-tune the next DR run.
After each event, compare zone-level kW reduction with occupancy and daylight data. Then check those numbers against occupancy and daylight conditions from the same event window. That side-by-side review helps you see where dimming can go deeper and where it should stay higher.
A zone-by-zone look makes the next move clearer. If one zone shows no comfort or productivity issues, you may be able to lower output a bit more next time. If another zone shows signs of discomfort, keep the reduction lighter.
Once your zone settings are dialed in, use that same event data to document savings for rebates and retrofit planning.
DR load data is a planning tool, not just a record. Use measured DR savings to back up rebate claims and ROI calculations. Networked lighting controls can help unlock higher incentive tiers and qualify for certain demand response programs.
For warehouses, industrial facilities, offices, and municipal buildings, this data can also help show whether a broader LED retrofit or controls expansion pencils out. That matters even more when 179D tax deduction eligibility is part of the discussion.
Use each event to refine zone levels, document savings, and improve the next DR cycle.
No. LED lighting is a strong starting point, but demand response calls for advanced equipment like networked lighting controls, smart sensors, and communication protocols that work together.
Basic LED setups with simple controls, such as timers or occupancy sensors, usually can't receive utility signals or adjust load in real time. In most cases, you'll need a networked upgrade.
The sources don’t give an exact point at which people start to notice dimming.
What they do say is this: demand response rules like the 2024 IECC call for lighting to dim gradually, over as much as 15 minutes, to 80% or less of full output during peak demand events.
In practice, it’s smart to test your dimming settings and ask occupants for feedback. That helps you find the right balance between energy savings and visual comfort.
Track real-time power use (watts) and energy use (kWh) in 15-minute intervals. This also lets you monitor system status, including lamp and sensor health, so teams can verify responses with confidence for utility reporting.
Occupancy data helps tie lighting changes to how people use the space. Ambient light and temperature add useful context too, especially when you need to explain shifts in consumption.


