.svg)
Use real-time submeters, smart sensors, and LED controls to cut warehouse energy use 25–40% and reduce demand charges.

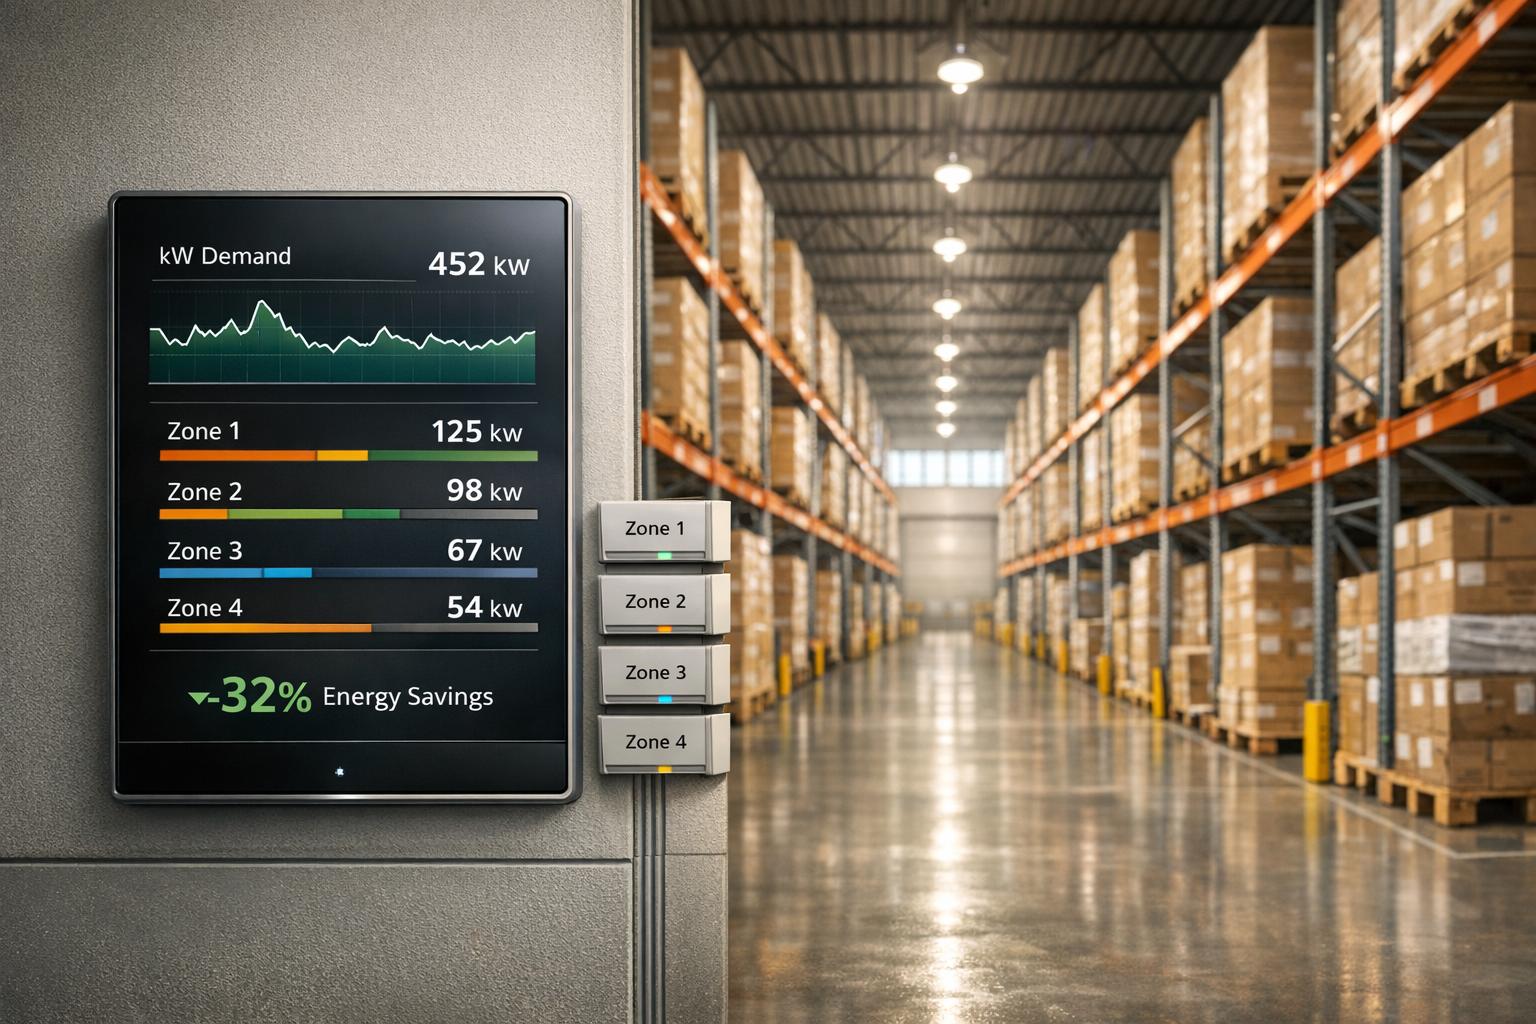
Warehouses spend 15%–25% of operating costs on energy, with lighting alone consuming 30%–40% of electricity. Yet, many rely on outdated monthly bills, making it hard to track and reduce waste. Real-time energy monitoring solves this by pinpointing inefficiencies and offering actionable insights. Here's how you can cut costs by 25%–40%:
Switching to LED lighting with smart controls can cut lighting energy costs by 70%–80%. Most monitoring systems pay for themselves within 3–6 months, making this a smart investment for warehouses looking to save money and improve efficiency.
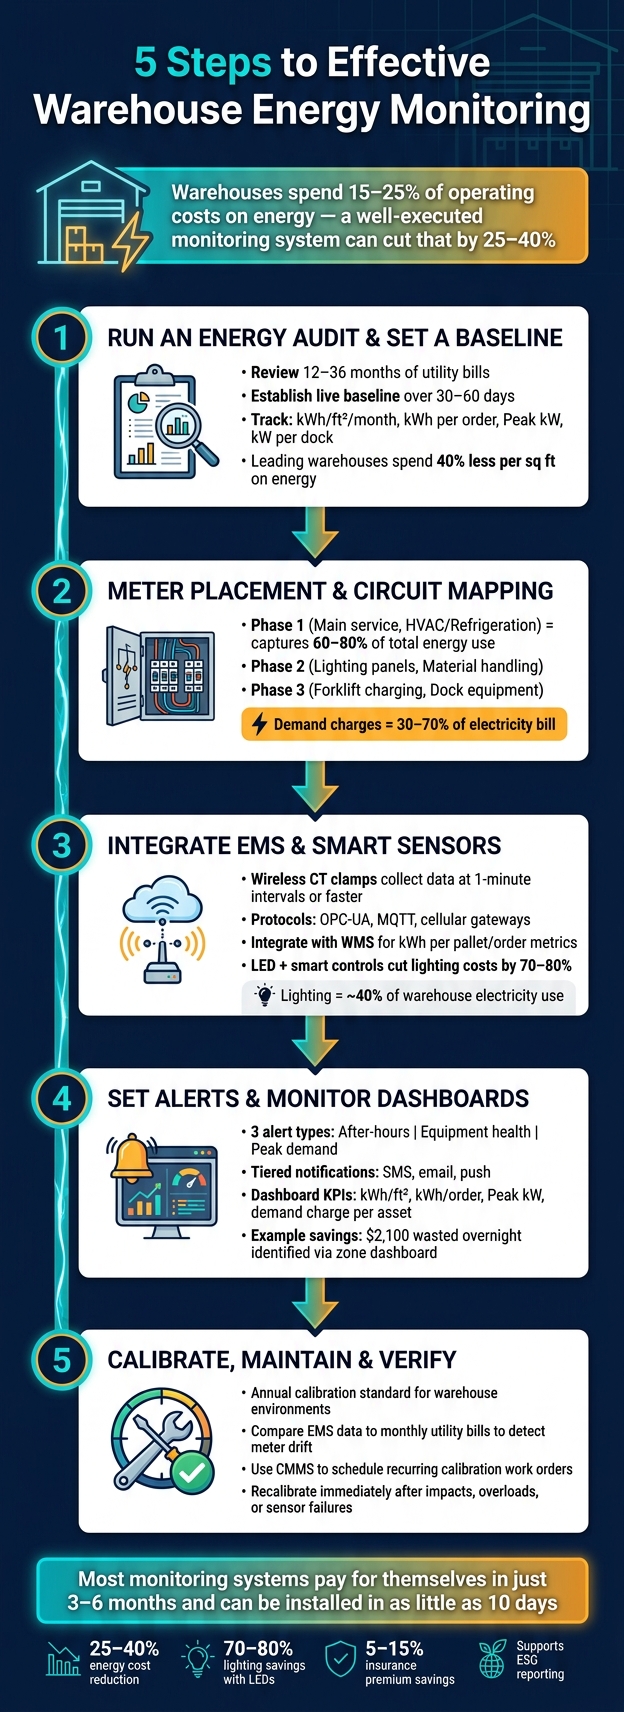
5-Step Warehouse Energy Monitoring System: Cut Costs by 25–40%
To improve energy performance in your facility, the first step is understanding how energy is currently being used. Start by reviewing 12–36 months of utility bills to analyze total kWh consumption, peak kW demand, and power factor trends. This data helps identify seasonal patterns and any unexpected cost increases. Then, establish a live baseline over 30–60 days using submeters or wireless CT clamps. Unlike whole-building utility data, this real-time monitoring provides detailed insights by breaking down energy use by zones and systems. Once the baseline is set, prioritize gathering data from the areas with the highest energy demand.
The most critical baseline data comes from the top energy-consuming systems in a warehouse: lighting, HVAC/refrigeration, and material handling equipment (such as conveyors, compressors, and forklift charging stations). Since lighting often represents a large share of energy use, measuring its consumption separately is a smart move.
Compare energy usage to shift patterns and WMS (Warehouse Management System) data to detect after-hours waste, like dock heaters running unnecessarily or lights left on in unused areas. Once you've collected accurate data, use it to define clear operational benchmarks.
To ensure energy performance aligns with operational output, normalize your data using metrics like kWh per order, kWh per pallet processed, or kWh per square foot per month. This method prevents high-volume periods from obscuring inefficiencies.
"Start with measure → target → tune: submeter, set KPIs, then optimize." - Warehouse Whisper
Use this baseline data to set measurable targets. Focus on key performance indicators (KPIs) from the start, such as:
| KPI Metric | What It Measures |
|---|---|
| kWh/ft²/month | Energy density and overall building efficiency |
| kWh per order | Energy costs relative to throughput |
| Peak kW | Demand spikes that could lead to utility penalties |
| kW per dock | Energy intensity related to loading and unloading activities |
Leading warehouses spend 40% less per square foot on energy compared to average facilities. By establishing a solid energy baseline and monitoring these KPIs, you can uncover opportunities to reduce energy costs significantly.
For those needing expert advice, Luminate Lighting Group offers specialized energy audits that deliver actionable insights to help optimize energy usage effectively.
With your baseline in place, the next step is to determine where to position meters for the best results. The goal? Avoid gaps in data while keeping the number of sensors to a minimum. Start by focusing on areas with the highest energy usage to tackle the most impactful consumption first.
A smart approach is to roll out meters in phases. Begin with the main electrical service entrance and major equipment like chillers, boilers, and air handling units. This initial phase typically captures 60% to 80% of a building’s total energy use.
Once you’ve got the big picture, move to zone-level monitoring. Break circuits down by function - think lighting, HVAC, refrigeration, conveyors, and forklift charging stations. Pay special attention to circuits drawing more than 50 kW, as these high-load circuits often drive demand charges, which can account for 30% to 70% of your electricity bill.
Don’t overlook dock equipment. Dock heaters and levelers often waste energy because they run continuously, even when unnecessary. For instance, a 350,000 sq. ft. fulfillment center monitored by Envigilance discovered $54,000 in annual energy waste. A major chunk of that came from dock heaters running non-stop and HVAC systems conditioning unused mezzanine areas.
| Load Category | Monitoring Priority | Key Consideration |
|---|---|---|
| Main Service Entrance | Phase 1 | Tracks peak demand and sets the facility’s energy baseline |
| HVAC & Refrigeration | Phase 1 | Critical for cold storage with large, continuous loads |
| Lighting Panels | Phase 2 | A major energy draw in many warehouses |
| Material Handling | Phase 2 | Includes conveyors and systems with variable duty cycles |
| Forklift Charging Stations | Phase 3 | Can cause demand spikes if not properly managed |
| Dock Equipment | Phase 3 | Common source of waste from heaters and levelers |
Once meters are installed, it’s crucial to label circuits clearly and consistently. This ensures the data you collect is actionable and traceable. Accurate circuit mapping is key to replicating the detailed insights gathered during your baseline audit.
Start by reviewing the facility’s single-line diagram to confirm how panels feed different zones, avoiding errors in data attribution. When installing current transformers (CTs), double-check polarity and phase alignment. Mistakes here can lead to flawed readings and inaccurate load calculations. After installation, compare live readings with equipment nameplate ratings to verify accuracy.
"The meter itself does not save energy. The actions you take based on the data do." - Richie King, Vice President of Finance and Accounting, Vutility
Label each monitored circuit in both the physical panel directory and your energy management software. Use clear, consistent naming like "HVAC-AHU-3-NorthZone" instead of vague panel numbers. This practice simplifies tracking and helps pinpoint anomalies in energy use.
Strategic meter placement and thorough circuit mapping are the foundation for effective energy monitoring and better decision-making.
Now it's time to connect your meters and sensors to an Energy Management System (EMS) for real-time insights. By combining the data from your meter placement and circuit mapping, the EMS consolidates all energy usage information into a single, actionable view of your facility. Without this integration, your data remains fragmented and much harder to use effectively.
Modern smart sensors, like wireless CT clamps, can be easily attached to existing wiring. These sensors collect high-resolution telemetry at 1-minute intervals or faster, which is crucial for detecting short-duration events such as conveyor start-ups or the inrush currents of forklift chargers.
To transmit data from sensors to your analytics platform, you can use protocol translators with OPC-UA or MQTT to connect field devices to cloud systems. If internal network access is limited or presents security risks, cellular gateways offer a secure alternative.
You can also integrate your EMS with your Warehouse Management System (WMS) to link energy consumption with operational data. This allows you to generate practical metrics like kWh per pallet moved or kWh per order fulfilled. To ensure the security and reliability of your energy data, implement network segmentation and encrypted telemetry - critical steps for maintaining a robust energy strategy.
"Start with high-resolution telemetry for 90 days before any capital project. You cannot manage what you don't measure - and high-frequency data lets you separate operational cycles from ambient load patterns." - Jordan Morales, Senior Energy Systems Editor
Once data transmission is securely in place, you can shift your focus to integrating smart lighting systems.
Lighting typically accounts for about 40% of a warehouse's electricity use, making it one of the most impactful areas to improve. Upgrading to LED lighting with smart controls - such as occupancy sensors, daylight harvesting, and aisle-based group controls - can cut lighting energy costs by 70–80% compared to older metal halide or T5 fixtures.
Occupancy-based controls ensure lights are only active where workers are present, while photosensors used for daylight harvesting should be distributed across multiple zones - near skylights, mid-facility, and at the far ends - to account for shifting natural light throughout the day. To avoid distracting employees, configure dimming transitions to be gradual, with ramps of 5 to 30 seconds.
Luminate Lighting Group offers specialized services for warehouse lighting upgrades, including LED retrofit designs, smart lighting control specifications, photometric layouts, and energy audits. They also assist with utility rebates and 179D tax deductions. With a typical ROI of 1–2 years and minimal installation challenges, LED lighting with smart controls is often the quickest and most effective improvement in a warehouse energy plan.
This integration sets the stage for even more advanced energy-saving strategies.
Now that your Energy Management System (EMS) is up and running, with sensors actively collecting data, the next step is to transform that raw information into meaningful insights. This involves setting up your EMS to detect anomalies early, preventing them from escalating into expensive problems.
Generic alert settings won’t cut it. Start by establishing thresholds based on real operational data. Collect a 30–60 day baseline of metrics like kWh, peak kW, and power factor to define what "normal" looks like. Use this baseline to fine-tune your alert parameters.
Focus on three key alert categories that directly impact operations:
Set up tiered notifications so that the right teams handle the right issues - maintenance can address equipment problems while operations manage demand spikes. Use tools like SMS, email, and push notifications to ensure critical alerts are seen and acted upon. As eGauge explains:
"Energy utilization is more complicated than ever, and energy professionals work hard to prevent loss from unexpected failures... tools like the eGauge Pro can help energy professionals prevent these losses by monitoring for unexpected activity and sending alerts via text message and email."
Be cautious when calibrating thresholds. If alerts are too sensitive, they may overwhelm your team, leading to alert fatigue and missed notifications.
Once your alerts are configured, the next step is to leverage a dashboard for real-time monitoring and decision-making.
Alerts are just the first step - dashboards provide the context and clarity needed to act quickly. A well-designed dashboard helps you spot inefficiencies in real time, offering detailed insights down to the circuit or equipment level. This eliminates the need to wait for your monthly utility bill to identify issues.
Organize your dashboard around critical KPIs, such as:
Zone-based views are particularly effective. For example, if your dashboard shows that Zone A lighting consumed $4,200, the dock area HVAC used $3,800, and $2,100 was wasted overnight, you have clear targets for improvement.
"A dashboard that shows everything usually gets checked monthly, at most. A dashboard that shows three clear signals gets checked weekly - and those signals trigger real action." - Echelon Lighting Solutions
Another smart approach is to display live consumption data on screens in common areas like break rooms. This creates a visual reminder for your workforce, encouraging energy-conscious behavior without needing formal policy changes.
For warehouses aiming to take their energy performance to the next level, combining these monitoring strategies with targeted upgrades - like those offered by Luminate Lighting Group - can help cut costs, boost efficiency, and ensure compliance with local energy codes.
Even the most advanced systems can lose accuracy over time due to wear and tear, unexpected impacts, or shifting conditions. To keep energy-saving insights reliable, regular calibration, routine maintenance, and consistent verification are essential. Without these measures, decisions may gradually rely on flawed data, undermining the energy savings you've worked hard to achieve.
A key part of maintaining reliable data is ensuring your meters remain accurate. One effective method is comparing EMS (Energy Management System) data to your monthly utility bills. This helps identify potential meter drift. For a more thorough check, use a reference device that's 6–10 times more accurate than the meter being tested. As Eastron Electronic Co., Ltd. emphasizes:
"Periodic calibration ensures that the meter's readings remain accurate and reflect true energy consumption."
Annual calibration is widely accepted as the standard for warehouse environments, balancing cost with precision. However, don't wait for the next scheduled calibration after major events like physical impacts, electrical overloads, or suspected sensor failures - address these immediately. For larger energy audits, it's a good practice to calibrate instruments both before and after the project to ensure the data's reliability.
"The most common requirement is annual calibration, but this can vary dramatically depending on the application, industry regulation, or QA requirements." - Fluke
To simplify the process, use a CMMS (Computerized Maintenance Management System) to schedule calibration tasks as recurring work orders. All calibrations should meet NIST standards and be conducted by ISO 9001:2015 certified suppliers.
Once you've verified meter accuracy, shift your focus to maintaining sensors and communication systems to ensure data integrity.
Meter calibration alone isn’t enough - your sensors and communication systems need consistent care too. Regularly inspect sensors for issues like cable damage, overheating, or waterproofing problems.
For wireless setups, keep an eye on gateway connectivity and sensor batteries to prevent data interruptions. In warehouses with heavy metal racking or dense equipment, wireless signals may weaken. If you notice intermittent data dropouts, conduct a site survey to adjust gateway placement or add repeaters before these gaps impact your reporting.
Also, update sensor configurations whenever there are changes to the layout or operations. For high-traffic areas where frequent recalibration can disrupt workflows, self-calibrating sensors might be a smart investment.
Energy monitoring isn’t a one-and-done task - it’s an ongoing process. The key is to follow a simple but effective cycle: measure, target, tune. This approach not only trims energy costs but also improves how your warehouse operates day-to-day.
Here’s a striking fact: energy costs eat up 15%–25% of operating expenses, and 20%–30% of that is often wasted due to inefficiencies. But there’s good news - a well-executed monitoring system can slash overall energy costs by 25% to 40%. Lighting alone offers massive savings, with reductions of 30% to 70% when you switch to LEDs and add occupancy controls. If you’re considering LED retrofits or smart lighting upgrades, companies like Luminate Lighting Group can help you identify the best options.
"Energy management is one of the fastest, cleanest levers to lower operating costs." - warehousewhisper.com
The benefits don’t stop at cost reductions. Energy monitoring can unlock other financial perks, like utility demand response incentives and 5% to 15% savings on insurance premiums. It also supports ESG reporting by providing data that aligns with corporate sustainability goals. On the operational side, it enables proactive maintenance - catching equipment problems, such as a conveyor with unusual power usage, before they turn into expensive breakdowns.
Even better, most monitoring systems pay for themselves in just 3–6 months and can be installed in as little as 10 days without disrupting your workflow. Long-term, the ability to track energy usage, identify spikes, and respond effectively is what sets high-performing warehouses apart from the rest.
To get started, monitor your overall energy usage and implement submetering for specific zones and equipment. This approach makes it easier to spot inefficiencies and unnecessary energy waste in critical systems such as lighting, HVAC, and machinery. By focusing on these areas, you can make targeted adjustments that lead to smarter energy use.
The number and location of meters will vary based on the size of your warehouse and its operational zones. Generally, you’ll want to install meters to monitor essential areas like lighting, HVAC systems, refrigeration units, and other major equipment. Position these meters within your electrical panel, focusing on circuits or zones you need to track. Make sure they’re securely installed, easy to access for maintenance, and sufficient in number to effectively monitor all critical zones for accurate energy usage data.
To keep alert fatigue in check while pinpointing energy waste, concentrate on alerts that lead to clear actions and prioritize those tied to major concerns. Regularly evaluate and fine-tune your alerts to cut down on excessive or irrelevant notifications. Implement custom alarms designed specifically for your warehouse's needs, alongside monitoring tools that align with your data patterns. This approach reduces false alarms and ensures your team focuses only on alerts that spotlight meaningful inefficiencies.


