.svg)
Smart lighting controls with benchmarking cut commercial lighting energy use, lower costs, and verify savings with real-time analytics and incentive support.
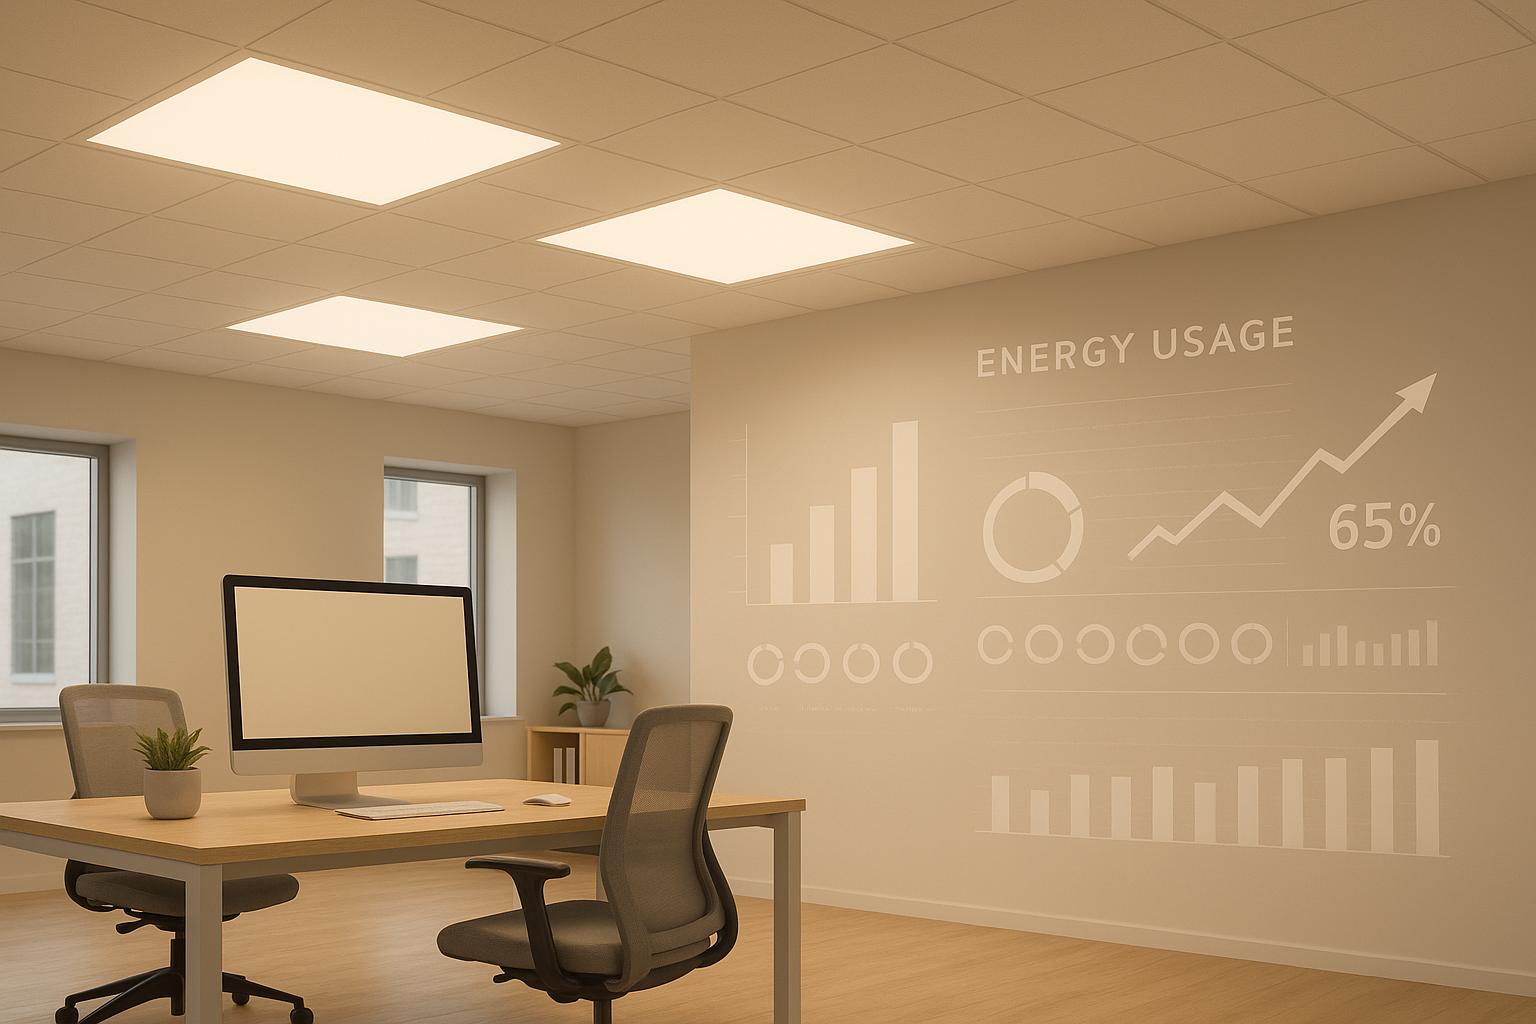
Energy benchmarking helps measure and compare a building's energy efficiency, focusing on metrics like Energy Use Intensity (EUI). Lighting, which accounts for 20–30% of energy use in U.S. commercial buildings, is a key area for improvement. Smart lighting controls - featuring motion sensors, dimming, and scheduling - enable real-time tracking of energy usage, offering detailed insights that traditional methods can't provide. These systems can cut lighting energy use by up to 70%, reduce costs, and qualify for rebates and tax incentives. By combining smart controls with benchmarking, businesses can achieve measurable energy savings and optimize performance over time.
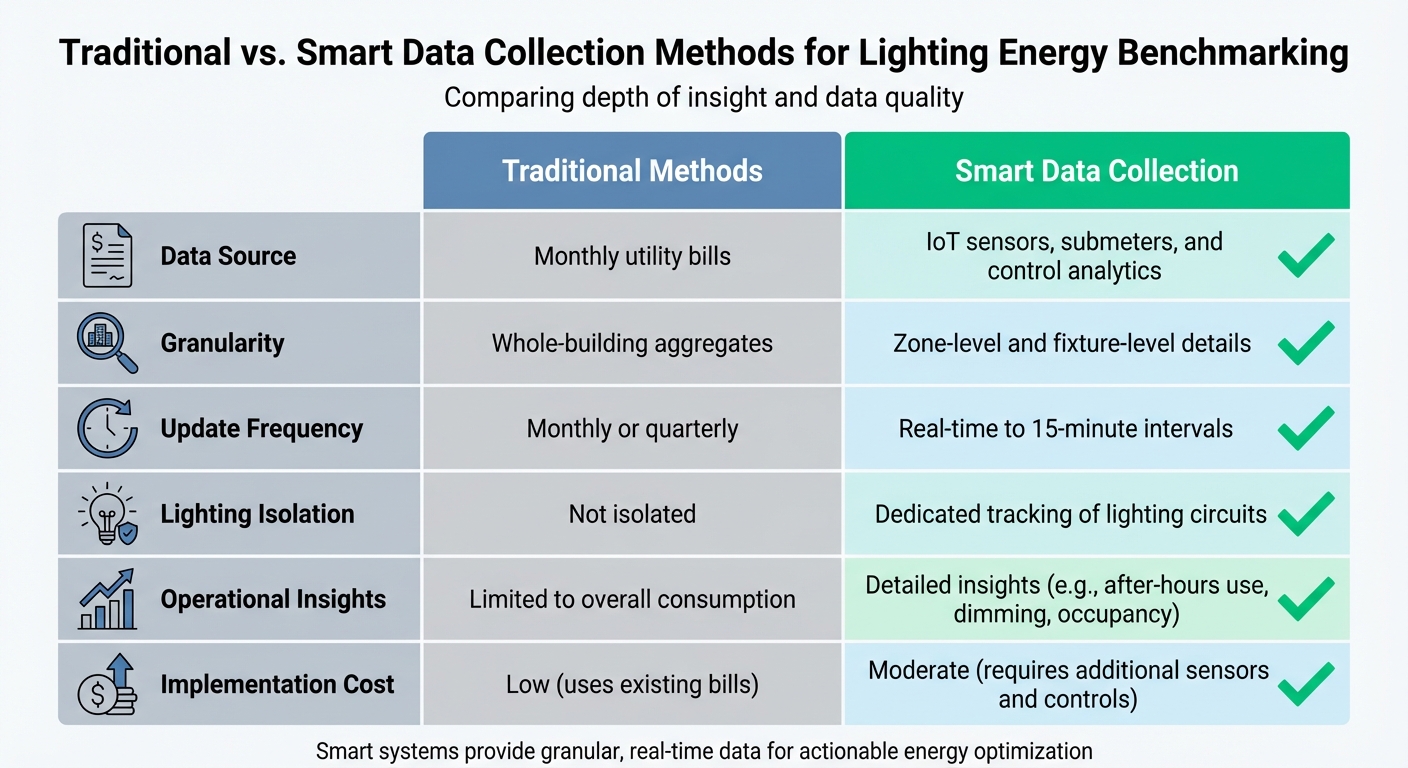
Traditional vs Smart Lighting Data Collection Methods Comparison
One of the primary metrics for energy benchmarking in lighting is Lighting Energy Use Intensity (EUI). This is calculated by dividing the total annual lighting energy consumption (in kWh) by the conditioned floor area, resulting in a value expressed as kWh per square foot per year. This metric makes it easier to compare lighting performance across buildings of varying sizes.
Other important metrics include annual lighting kWh consumption, which measures the total energy used by lighting circuits over a year. This data is often sourced from utility bills or dedicated lighting submeters. Peak lighting demand, another key figure, captures the highest load recorded during a 15-minute interval. For a more nuanced view, occupancy-adjusted metrics - like kWh per occupied hour or kWh per occupied square foot - factor in actual space usage. These metrics are increasingly enabled by smart occupancy sensors, which replace static schedules with real-time tracking.
This standardized approach provides a solid foundation for comparing traditional data collection methods with smarter, more advanced systems.
Traditional lighting benchmarking methods typically rely on monthly utility bills, which offer aggregated, whole-building energy consumption data. While straightforward, this approach limits analysis to just 12 data points per year, providing only a broad overview.
Smart data collection, on the other hand, uses tools like lighting submeters, IoT sensors, and networked control platforms to deliver highly detailed, near-real-time data. This allows for zone-level or even fixture-level insights, offering a much clearer picture of operational performance and energy use.
| Aspect | Traditional Methods | Smart Data Collection |
|---|---|---|
| Data Source | Monthly utility bills | IoT sensors, submeters, and control analytics |
| Granularity | Whole-building aggregates | Zone-level and fixture-level details |
| Update Frequency | Monthly or quarterly | Real-time to 15-minute intervals |
| Lighting Isolation | Not isolated | Dedicated tracking of lighting circuits |
| Operational Insights | Limited to overall consumption | Detailed insights (e.g., after-hours use, dimming, occupancy) |
| Implementation Cost | Low (uses existing bills) | Moderate (requires additional sensors and controls) |
The table above outlines the key differences between traditional and smart methods, illustrating the greater depth of insight provided by modern, sensor-based systems.
Smart lighting systems take benchmarking to the next level by generating diverse and detailed data streams. For example, occupancy sensors provide time-stamped records for each zone, enabling metrics like kWh per occupied hour and ensuring lights are turned off when spaces are unoccupied. Daylight harvesting systems track how electric lighting adjusts to natural light, helping measure energy savings from daylight use. Additionally, networked controls capture run-time hours and dimming profiles for individual fixtures or zones, which can be used to calculate equivalent full-load hours.
Key performance indicators available through smart systems include:
Smart lighting platforms export this data in standardized formats compatible with tools like ENERGY STAR® Portfolio Manager, enabling continuous monitoring and providing actionable insights for improving energy performance.
Smart lighting controls come in various forms, each designed to reduce energy use while enhancing functionality.
Occupancy sensors rely on motion detection or infrared technology to automatically control lighting. By turning lights on or off based on room usage, these sensors help avoid energy waste in spaces like conference rooms, restrooms, and private offices. This approach can cut energy consumption in these areas by an impressive 30-60%.
Daylight harvesting systems utilize photocells to measure natural light levels and adjust artificial lighting accordingly. In areas with abundant natural light - like perimeter offices, atriums, or warehouses with skylights - these systems balance daylight and electric light, resulting in energy savings of 20-40%.
Scheduling systems ensure lights operate only when needed by aligning lighting schedules with business hours. This prevents unnecessary energy use during nights, weekends, and holidays, reducing lighting energy consumption by 20-30%.
Task tuning customizes light levels based on the needs of specific spaces. For example, areas used for detailed tasks might require brighter lighting, while hallways or general spaces can function effectively with lower levels. This tailored approach can achieve savings of 15-30%.
Together, these technologies provide a strong foundation for reducing energy use and improving efficiency.
When implemented, smart lighting controls can deliver substantial energy and cost savings. Depending on the combination of technologies used, energy reductions range from 20-60%, with some systems achieving up to 70% savings in high-use areas. These percentages translate into tangible financial benefits: at an average utility rate of $0.12 per kWh, businesses can save between $0.50 and $2.00 annually per square foot.
The financial perks don’t stop there. Many installations qualify for utility rebates of $0.03 to $0.10 per kWh saved and may also meet the requirements for 179D tax deductions, which can be as high as $1.88 per square foot for energy-efficient upgrades. With these incentives, many projects see a return on investment in less than two years, especially in facilities with high energy usage or poor lighting habits.
Beyond cost savings, smart lighting systems improve operational efficiency. They enhance occupant comfort by maintaining consistent lighting levels, reduce maintenance expenses through predictive analytics that identify failing fixtures early, and increase property value by demonstrating measurable energy efficiency. Buildings with proven energy performance often stand out in competitive markets.
Cloud platform integration takes smart lighting to the next level by connecting sensors, dimmers, and gateways to centralized systems via IoT protocols like Zigbee or Wi-Fi. This connectivity allows real-time data from individual fixtures across multiple locations to be aggregated into a single, unified platform.
Through centralized dashboards, users can monitor usage trends, generate automated reports on daily energy consumption and peak demand, and compare performance against historical data or industry benchmarks. These platforms translate raw data into actionable metrics like Energy Use Intensity (kBtu per square foot) and send alerts for anomalies, such as system faults or unusual patterns.
Cloud analytics also help identify optimization opportunities. For instance, predictive algorithms can suggest adjustments to dimming schedules, capturing an additional 15-25% in energy savings. By automating data collection and analysis, these systems make tracking and improving performance seamless, ensuring continuous efficiency without the need for manual intervention.
Start by identifying the buildings or areas you want to assess. This could include a single site, multiple locations, or specific zones like office spaces, parking garages, or warehouse floors. Take inventory of the lighting systems in place and note if any use smart controls.
Set a time frame for your analysis, typically 12 to 36 months, aligning it with your fiscal year and utility billing cycles. Record operating hours to ensure your metrics are consistent and comparable.
Next, establish clear and measurable goals. For instance, you might aim to reduce lighting Energy Use Intensity (EUI) by 15% within two years, lower annual lighting costs by $0.30 per square foot, or meet local building performance standards. If reducing environmental impact is a priority, consider setting goals tied to greenhouse gas reductions or corporate ESG commitments. Additionally, many facilities aim to qualify for utility rebates or 179D tax deductions by documenting both baseline and post-project performance.
Focus on areas with long operating hours, high energy costs, or noticeable over-lighting. These spaces often offer the quickest opportunities for savings. Once your objectives are in place, you’re ready to gather the baseline data needed for analysis.
Start by gathering 12 to 24 months of utility bills, including details like total kWh, demand charges (kW), costs, and rate structures. This data helps identify seasonal trends and the main factors driving your electricity expenses.
If you have smart lighting systems, export detailed records such as fixture-level kWh usage, run times, dimming levels, occupancy events, and daylight sensor readings. Ideally, collect data at intervals of 5 minutes to an hour, which allows for precise control strategies.
You’ll also need building-specific details to normalize your metrics - things like floor area (in square feet), occupancy density, operating hours, and the types and wattages of fixtures. For spaces without smart controls, use nameplate wattages, fixture counts, and short-term data loggers in sample areas to estimate lighting loads.
Clean up your data by removing duplicates, filling in gaps, and correcting errors. Aggregate the data into consistent intervals (hourly or daily totals) and align timestamps to a single time zone, accounting for daylight saving time. Normalize energy usage by square foot and operating hour to ensure fair comparisons across different spaces. Organize everything in a clear template by building, space type, and month to track key metrics over time.
If lighting isn’t separately metered, calculate the connected load by multiplying fixture wattage by the number of fixtures, then estimate run hours using smart controls or other data. Cross-check these calculations against total utility consumption and benchmarks for similar building types to ensure accuracy.
With your baseline data ready, it’s time to dig into the numbers to uncover savings opportunities.
Compare metrics like lighting EUI, power density, and cost per square foot across different space types. Use internal benchmarks and external tools like the ENERGY STAR Portfolio Manager to identify outliers consuming more energy than expected.
For example, one commercial property portfolio used IoT sensors to benchmark their lighting systems. This approach helped them detect inefficiencies early, improve maintenance practices, and lower their Energy Use Intensity by 12%, saving significantly on utility costs.
Review time-of-day profiles from smart lighting data to identify after-hours energy usage - kWh consumed outside of scheduled operating times. Check how much energy is used at full brightness versus dimmed levels. These insights can highlight opportunities to tighten schedules, install vacancy sensors, or adjust default light settings.
Examine peak-demand periods when lighting overlaps with other high-energy loads. Strategies like dimming or shifting lighting loads during these intervals can reduce demand charges. Focus on control measures that your analysis shows to have the most impact, such as occupancy sensors, daylight harvesting, tighter scheduling, or high-end trim (reducing maximum light output). Keep tracking these metrics over time to ensure improvements stick and to spot any performance issues that may arise with changes in occupancy or schedules.

Luminate Lighting Group offers tailored smart lighting solutions designed to simplify energy benchmarking and improve efficiency for a variety of facilities.
We specialize in LED retrofits with advanced smart controls that provide the detailed data needed for effective energy benchmarking. Whether it's a warehouse, industrial site, office, or municipal building - some of the biggest energy consumers in the U.S. - our systems are designed to deliver time-stamped usage data at either the fixture or zone level. This allows you to calculate lighting energy consumption (kWh) by area, monitor operating hours, and analyze load profiles with precision.
To kick things off, we conduct on-site energy audits to document existing fixtures, wattages, controls, and run-time assumptions. This data creates a baseline lighting load and estimated annual energy use (kWh) for each space type. By aligning this with your overall utility data, we help pinpoint how much of your total energy consumption is tied to lighting. During the audit, we also identify areas where smart controls can address inefficiencies like over-lighting or unnecessary run-time - problems often highlighted by benchmarking as higher-than-normal energy intensity when compared to similar buildings. Many of our clients see energy reductions of 50–80% after upgrading to our LED solutions, with further savings in the double-digit range when smart controls are added. This detailed data collection lays the groundwork for smarter, more customized benchmarking strategies.
Before implementing upgrades, we establish baseline metrics such as lighting energy use per square foot, per operating hour, and per occupant. From there, we help set realistic energy-saving goals - like reducing lighting energy consumption by 30–60% - tailored to your facility’s unique needs, operating schedule, and industry benchmarks. This approach not only complements traditional methods but also provides ongoing performance data for deeper energy analysis.
Our process doesn’t stop at installation. We follow a comprehensive project plan that includes pre-project benchmarking, energy audits, system design, installation management, and post-installation measurement and verification. After the upgrades are complete, we compare the new energy use against the original baseline, accounting for factors like changes in operating hours or occupancy. This allows us to quantify verified savings and fine-tune your benchmarks. Instead of a one-and-done approach, this continuous feedback loop supports ongoing operational improvements. Benchmarking programs with similar strategies have reported cumulative energy savings of about 7% over three years.
We also streamline the process of securing utility rebates for high-efficiency LED fixtures and smart controls. Using our audit data, we prepare the necessary documentation - like pre- and post-project wattage, usage hours, and projected energy savings - to maximize your rebate amounts and shorten payback periods. By combining these rebates with the verified savings from benchmarking, we help you clearly demonstrate the financial benefits, often achieving payback in just a few years.
For U.S. commercial and municipal projects, we assist clients in pursuing Section 179D tax deductions, which reward measurable improvements in building energy efficiency. Since these deductions require third-party verification of energy performance improvements, our detailed benchmarking data - covering lighting energy use, power density, and overall building performance - provides the technical foundation needed to claim the deduction. When combined with utility rebates and verified savings, these benefits significantly boost project ROI, making smart lighting upgrades a strong financial and strategic investment. Through rigorous benchmarking, these measures not only deliver fast returns but also support long-term, sustainable energy strategies.
Benchmarking, when combined with smart controls, delivers measurable energy savings. Studies show it can lead to up to a 12% reduction in Energy Use Intensity (EUI) and lower utility costs significantly. In fact, buildings that follow benchmarking policies tend to spend about 3% less on utility bills compared to similar properties that don’t.
The process of benchmarking goes beyond just compliance. It starts with defining the scope, collecting baseline data, and analyzing that data for opportunities like adjusting occupancy settings. Progress is then tracked using tools like cloud analytics, turning benchmarking into a strategy for ongoing improvement.
Smart lighting controls make this process even more effective. Tools like motion sensors, daylight harvesting systems, and networked controls provide real-time, detailed data to identify energy waste. This allows you to focus on projects that deliver the biggest impact and measure savings against your original benchmarks. Plus, this data can help you qualify for utility rebates and 179D tax deductions, improving your return on investment and shortening the payback period.
At Luminate Lighting Group, we integrate these benefits into our tailored solutions. Our smart lighting systems and energy audits simplify the benchmarking process and amplify savings. From setting baseline metrics to verifying results after installation, we provide the technical expertise and documentation needed to calculate savings and access financial incentives. Whether you’re managing a warehouse, office, industrial site, or municipal building, we help you achieve your energy efficiency goals.
Smart lighting controls improve energy efficiency by automating how lighting systems operate to align with actual needs. These systems can adjust lighting based on factors like occupancy, natural daylight, or preset schedules, ensuring lights aren't left on unnecessarily. This not only reduces wasted energy but also keeps spaces appropriately lit.
On top of that, smart lighting systems offer detailed analytics and benchmarking data. This information helps uncover patterns and pinpoint areas where even more energy savings can be achieved.
By incorporating these controls, buildings can cut energy costs, support sustainability efforts, and hit energy performance targets - all while maintaining comfortable lighting for those using the space.
Smart lighting systems can dramatically cut energy costs - by as much as 50-80% - through advanced energy-efficient technologies and precise control over when and how lights are used. Beyond energy savings, they also help reduce maintenance expenses by extending the lifespan of lighting components, which means fewer replacements and repairs.
These systems don’t just save money; they also create safer and more productive environments by offering tailored illumination that meets specific needs. Over time, smart lighting proves to be a wise investment, delivering long-term savings while aligning with sustainability efforts and meeting energy code requirements.
Integrating smart lighting controls with cloud platforms brings a new level of efficiency to energy management. By enabling real-time monitoring, remote access, and detailed analytics, businesses can gain a clearer picture of their energy use, set performance benchmarks, and identify areas for improvement.
Cloud-based systems make it possible to manage lighting across multiple locations from anywhere. You can tweak settings remotely and dive into comprehensive insights to fine-tune operations. This approach not only helps cut down on energy expenses but also aligns with sustainability initiatives and ensures compliance with energy regulations.


